


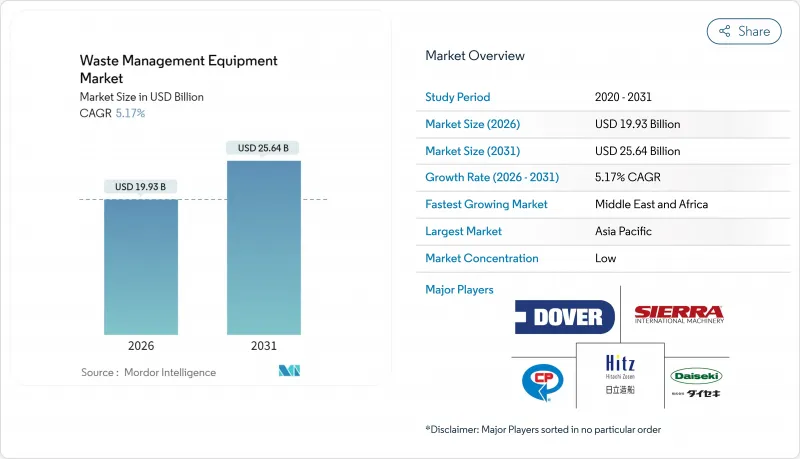
폐기물 관리 장비 시장은 2025년 189억 5,000만 달러로 평가되었고, 2026년 199억 3,000만 달러에서 2031년까지 256억 4,000만 달러에 이를 것으로 예측됩니다. 예측 기간(2026-2031년) CAGR은 5.17%로 성장이 전망되고 있습니다.

증가하는 일반폐기물(MSW)의 양, 보다 엄격한 매립처분 회피 정책, 재활용 인프라에 대한 투자 확대가 설비 수요를 가속화하고 있습니다. 아시아 및 아프리카의 급속한 도시화는 수집 및 처리 능력에 지속적인 부하를 가하고 있지만, 전자 기기를 활용한 자동화 업그레이드는 비용 절감 및 규제 준수를 실현하는 가장 빠른 수단으로 계속되고 있습니다. 상품 가격 변동과 사이버 보안 위험은 수익성을 억제하는 반면, 서비스로서의 설비(EaaS) 및 녹색 조달 의무는 세계 폐기물 관리 장비 시장에서 공급업체에게 새로운 수익원을 개척하고 있습니다.
대도시권의 인구 증가에 따라 인구 증가율을 상회하는 속도로 폐기물 발생량이 증가하고 있으며, 지자체는 수집 차량, 중계 스테이션, 자원 회수 시설의 갱신을 강요받고 있습니다. 세계 은행의 예측에 따르면 2050년까지 세계 일반 폐기물 발생량은 70% 증가하여, 사하라 이남아프리카 및 남아시아의 인프라 격차가 확대될 전망입니다. 수집, 선별 및 처리를 통합한 시스템을 도입함으로써 관리되지 않는 폐기물 1톤 당 375달러의 사회적 비용을 50-100달러로 줄일 수 있습니다. 기타큐슈시 등 일본 사례는 시민 참여 및 실시간 모니터링을 결합하여 경제 성장 및 폐기물 발생을 분리할 수 있음을 보여줍니다. 그 결과, 도시 지역에서는 스마트 쓰레기통, 광학 선별기, 전기 쓰레기 수거차에 대한 예산 배분이 증가하고, 세계의 폐기물 관리 장비 시장은 꾸준한 설비 증강의 길을 걷고 있습니다.
캘리포니아주 SB 1383법은 2025년까지 유기폐기물 재활용률 75%를 목표로 하고 있으며, 미국 환경보호청(EPA)은 250만 t 이상의 매립지에 가스 회수 시스템을 설치하도록 의무화하고 있습니다. 이것은 송풍기, 플레어 스택 및 감시 장치의 업그레이드를 촉진합니다. 새크라멘토시 등의 지자체에서는 대용량 퇴비 장치의 도입으로 이미 유기 폐기물의 전환율이 14% 향상되고 있습니다. 샌디에고시나 킹군의 건설 및 해체 조례에서는 65%의 회수율 목표가 설정되어, 건설업자를 특수한 파쇄기나 선별기로 이끌고 있습니다. 이러한 규제는 예측 가능한 갱신 주기를 확립하고, 특히 자동 선별 라인 등 전용 실적을 증명할 수 있는 플랫폼을 기기 구매자가 우선하도록 촉구하고 있습니다. 자동 분류 라인은 현재 세계 폐기물 관리 장비 업계 전반에서 컴플라이언스 전략의 핵심을 이루고 있습니다.
완전 자동 선별 라인은 수동 시스템보다 200-300% 고가이며, 소규모 도시에는 장벽이 됩니다. 차량의 전동화도 비슷한 가격 충격을 가져옵니다. 캘리포니아 지역 관리 구역에서는 96대의 차량 전동화에 트럭 요금 570만 달러, 충전기 비용 77만 달러를 산정했습니다. 보조금, 세액 공제, 유틸리티 리베이트가 부담을 줄이는 반면, 많은 구매자는 여전히 현대화를 늦추고 있습니다. EaaS 계약은 현재 설비 투자 비용을 상쇄하지만, 예산 제한을 해소하는 것이 아니라 자금 조달 기준이 성숙할 때까지 단기적인 세계 폐기물 관리 장비 시장의 침투를 늦추고 있습니다.
2025년 시점에서 재활용 및 선별 기계는 세계의 폐기물 관리 장비 시장의 68.21%를 차지했으며, 폐기 처리에서 자원 회수로의 구조적 전환을 나타내고 있습니다. 광학 선별기, 탄도식 분리기, AI 비전 로봇이 수작업 라인 대신 폐기물 전용 목표 달성 및 오염 벌칙 감소에 기여하고 있습니다. EU 및 미국 일부 국가의 규제에서는 최저 재생재 함량이 의무화되어 있으며, 고순도 처리 장치 수요를 견인하고 있습니다. 벤더 각사는 모듈성을 강조해, 대규모 토목 공사비를 들이지 않고 컨테이너, 플라스틱 및 섬유 라인을 추가할 수 있는 점을 어필하고 있습니다. 이 부문은 기업에 의한 넷 제로 공약에 의한 사용후 재생재 수요 증가도 추풍이 되고 있습니다.
폐기물 처리 설비는 수량에서는 뒤를 쫓고 있지만, 폐기물 에너지화나 탄소 포집 기술의 고도화를 배경으로, 2031년까지 7.05%라고 하는 가장 높은 CAGR을 나타낼 것으로 예측되고 있습니다. 버콕과 윌콕스가 앨버타주 최초의 CCS(탄소 포집 및 저장) 설비 부착 플랜트용으로 설계한 프런트엔드는 소각로가 배출량 감축 자산으로서도 기능하는 미래상을 나타내고 있습니다. 매립 가스 시스템, 바이오 건조기, 혐기성 소화기는 재활용과 경쟁하는 대신 보완하는 다양한 처리 도구를 완성합니다. 유기 폐기물의 분별이 엄격해지고 있는 가운데, 식품 폐기물 탈포장기 및 퇴비화 드럼은 제품 라인을 확대하고, 세계의 폐기물 관리 장비 시장 전체에서의 크로스셀 기회를 증폭시키고 있습니다.
2025년 세계 폐기물 관리 장비 시장 규모의 90.08%를 비유해 폐기물이 차지했으며, 이는 일반 폐기물(MSW) 및 상업 폐기물의 방대한 발생량을 반영하고 있습니다. 표준화된 카트, 리어 로더 및 중계 스테이션은 규모의 경제를 실현하여 대량 주문 및 부품 재고 공유를 가능하게 합니다. 그러나 EPA(미국 환경보호청)가 도입 예정인 전자 매니페스트 추적 규칙에 따라 유해폐기물 처리 설비의 성장률은 CAGR 6.41%로 가속되어 밀폐식 롤오프 컨테이너, 부압 컨테이너, 규제 준거 데이터 수집이 가능한 바코드 리더 수요를 환기합니다.
전문화를 통해 누설 감지 센서 및 원격 모니터링 기능을 통합하고 보다 엄격한 안전 기준을 충족하는 유해 폐기물 처리 장비 제조업체는 높은 이익률을 실현합니다. 코펜하겐 아토믹스와 딥 지오와 같은 제휴는 최첨단 방사성 물질 처리 솔루션을 돋보이게 합니다. 한편, 비유해 시스템에서는 혼합 플라스틱 흐름이나 습윤 유기물 처리용으로 AI 후부 개수가 도입되어 처리 능력과 재료 품질이 향상되고 있습니다. 이중화 성장 전략으로 종합적인 제품 포트폴리오가 세계의 폐기물 관리 장비 시장에서 공급업체 경쟁력의 핵심이 되고 있습니다.
2025년 시점에서 아시아태평양은 세계 폐기물 관리 장비 시장의 44.12%를 차지했으며, 중국과 인도의 도시 인구(총 15억명 이상)가 견인역이 되었습니다. 국가 5개년 계획에서는 고형 폐기물 처리 능력 확충이 우선되어, 광학 선별기나 폐기물 유래 연료(RDF) 라인의 수주가 촉진되고 있습니다. 한국의 AI 로봇 수출은 지역의 자동화 리더십을 보이는 한편, 일본의 시민 참여형 모델은 철저한 분별에 따른 성과를 보여줍니다. 공급망의 근접성도 공급업체에 유리하게 작용하고 있으며, 중국은 2050년까지 세계 철 스크랩 공급량의 약 45%를 차지할 것으로 예상되며, 지역의 순환 경제 프로젝트를 지원합니다.
북미는 배출량 규제 및 유기물 폐기 금지에 의해 설비 갱신이 촉진되는 안정된 갱신 시장으로 계속되고 있습니다. 캘리포니아의 유기물 폐기물 전환법 및 캐나다 최초의 CCS 대응 폐기물 발전 플랜트는 소화조, 컨베이어, 가스 정화 장치에 대한 수요를 환기하고 있습니다. 연방 정부의 보조금에 의한 배터리식 전기 쓰레기 수거차 도입은 기업의 탄소 삭감 목표에 따른 차량 갱신을 가속화하고 있습니다. 유럽도 비슷한 패턴을 따릅니다. 생산자 책임 확대 제도에 의해 재생재의 순도 기준이 인상되어, AI 비전에 의한 개조 및 고속 탄도 분리 장치가 필요해지고 있습니다.
중동 및 아프리카는 걸프 협력 회의(GCC) 회원국들이 '비전 2030' 목표 달성을 위해 폐기물 인프라를 현대화하고 있기 때문에 2031년까지 6.48%라는 가장 빠른 CAGR을 기록할 전망입니다. 새로운 플랜트는 종종 단계적 업그레이드가 아닌 자동화 라인을 직접 선택하여 최신 설계로 획기적으로 전환하고 있습니다. 사우디아라비아와 UAE의 민간 컨세션 모델은 수익원을 안정화시키고 다국적 기업의 투자 위험을 줄입니다. 사하라 이남의 도시는 자본 제약을 극복하기 위해 모듈식 전송 스테이션과 이동식 베일러를 채택하고 있으며 세계 폐기물 관리 장비 시장 전반에 걸쳐 공급업체의 기회를 확대하고 있습니다.
The Waste Management Equipment market was valued at USD 18.95 billion in 2025 and estimated to grow from USD 19.93 billion in 2026 to reach USD 25.64 billion by 2031, at a CAGR of 5.17% during the forecast period (2026-2031).
Growing municipal solid-waste (MSW) volumes, stricter landfill-diversion policies, and rising investment in recycling infrastructure are accelerating equipment demand. Rapid urbanization in Asia and Africa keeps collection and processing capacity under pressure, while electronics-enabled automation upgrades remain the quickest path to cost reduction and compliance. Commodity price volatility and cybersecurity risks temper profitability, but equipment-as-a-service and green-procurement mandates open fresh revenue streams for vendors across the Global Waste Management Equipment market.
Expanding metropolitan populations generate waste volumes that grow faster than headcounts, pushing municipalities to upgrade fleets, transfer stations, and material-recovery facilities. The World Bank projects global MSW generation to rise 70% by 2050, widening infrastructure gaps in Sub-Saharan Africa and South Asia. Integrated systems cut the USD 375 per-ton societal cost of unmanaged waste to USD 50-100 per ton when collection, sorting, and processing are combined. Japanese examples such as Kitakyushu show that citizen engagement paired with real-time monitoring can decouple economic growth from waste output. As a result, urban areas allocate bigger budgets to smart bins, optical sorters, and electric refuse trucks, keeping the Global Waste Management Equipment market on a steady capacity-addition path.
California's SB 1383 targets a 75% organic-waste recycling rate by 2025, while the U.S. EPA mandates gas-collection systems for landfills larger than 2.5 million Mg, prompting upgrades in blowers, flare stacks, and monitoring gear. Municipalities such as Sacramento have already lifted organic diversion by 14% after installing high-volume composters. Construction and demolition ordinances in San Diego and King County set 65% recovery thresholds, steering builders toward specialized crushers and screeners. These rules establish predictable replacement cycles, forcing equipment buyers to favor platforms that prove diversion metrics, especially automated sorting lines, now central to compliance strategies across the Global Waste Management Equipment industry.
Fully automated sorting lines can cost 200-300% more than manual systems, presenting prohibitive hurdles for smaller cities. Fleet electrification offers similar sticker shock: one California regional district calculated USD 5.7 million for trucks and USD 0.77 million for chargers to electrify 96 vehicles. Grants, tax credits, and utility rebates soften the blow, yet many buyers still delay modernization. EaaS contracts now offset CAPEX, but they do not erase budget limits, slowing near-term Global Waste Management Equipment market penetration until financing norms mature.
Other drivers and restraints analyzed in the detailed report include:
For complete list of drivers and restraints, kindly check the Table Of Contents.
Recycling and sorting machinery captured 68.21% Global Waste Management Equipment market share in 2025, signifying a structural pivot from disposal toward resource recovery. Optical sorters, ballistic separators, and AI-vision robots increasingly replace manual lines to meet diversion targets and lower contamination penalties. Regulations in the EU and select U.S. states impose minimum recycled-content mandates, creating a pull-through effect for high-purity processing gear. Vendors highlight modularity, allowing facilities to add containers, plastics, or fiber lines without large civil works costs. The segment also benefits from corporate net-zero pledges that raise demand for post-consumer recyclate.
Waste disposal equipment trails in volume but is expected to post the fastest 7.05% CAGR to 2031, driven by waste-to-energy and carbon-capture upgrades. Babcock & Wilcox's front-end design for Alberta's first CCS-equipped plant illustrates a future where incinerators double as emissions-mitigation assets. Landfill-gas systems, bio-dryers, and anaerobic digesters complete a diversified disposal toolkit, complementing recycling rather than competing with it. As organic diversion tightens, food-waste depackagers and composting drums expand their product breadth, amplifying cross-sell opportunities throughout the Global Waste Management Equipment market.
Non-hazardous flows constituted 90.08% of the Global Waste Management Equipment market size in 2025, reflecting ubiquitous MSW and commercial waste volumes. Standardized carts, rear-loaders, and transfer stations achieve economies of scale, allowing bulk orders and shared parts inventories. However, the EPA's forthcoming e-Manifest electronic tracking rule boosts hazardous-waste equipment growth to a 6.41% CAGR, spurring demand for sealed roll-offs, negative-pressure containers, and bar-code readers capable of compliant data capture.
Specialization yields a higher margin for hazardous-waste equipment makers, who integrate leak-detection sensors and remote monitoring to meet stricter safety codes. Partnerships such as Copenhagen Atomics and DeepGeo spotlight cutting-edge radioactive-material handling solutions. Meanwhile, non-hazardous systems welcome AI-retrofits for mixed-plastic streams and wet organics, improving throughput and material quality. Dual-track growth ensures comprehensive product portfolios remain central to vendor competitiveness across the Global Waste Management Equipment market.
The Waste Management Equipment Market Report is Segmented by Source (Residential, Commercial, Industrial, and More), by Service Type (Collection, Transportation, Sorting & Segregation, and More), by Waste Type (Municipal Solid, Industrial Hazardous Waste, E-Waste, and More), and by Geography (North America, South America, Europe, Asia-Pacific and Middle East and Africa). The Market Forecasts are Provided in Terms of Value (USD).
Asia-Pacific held 44.12% of the Global Waste Management Equipment market in 2025, anchored by China's and India's urban populations that eclipse 1.5 billion residents combined. National five-year plans prioritize solid-waste capacity, prompting orders for optical sorters and refuse-derived-fuel lines. South Korea's AI-robot exports illustrate regional leadership in automation, while Japan's citizen-engagement model shows the gains possible from meticulous source separation. Supply-chain proximity also benefits equipment vendors, as China is forecast to provide almost 45% of the world's scrap steel by 2050, supporting regional circular-economy projects.
North America remains a steady replacement market where emission caps and organics bans stimulate upgrades. California's organic-diversion law and Canada's first CCS-enabled waste-to-energy plant foster demand for digesters, conveyors, and gas-cleanup skids. Federal grants financing battery-electric refuse fleets accelerate fleet turnover, aligning with corporate carbon pledges. Europe follows similar patterns: extended-producer-responsibility schemes push recyclate purity thresholds, requiring AI-vision retrofits and high-speed ballistic separators.
The Middle East & Africa posts the fastest 6.48% CAGR to 2031 as Gulf Cooperation Council states modernize waste infrastructure to meet Vision 2030 agendas. New plants often leapfrog to the latest designs, opting straight for automated lines rather than incremental upgrades. Public-private concession models in Saudi Arabia and the UAE stabilize revenue streams, lowering investment risk for multinationals. Sub-Saharan cities adopt modular transfer stations and mobile balers to overcome capital constraints, broadening vendor opportunities across the Global Waste Management Equipment market.