


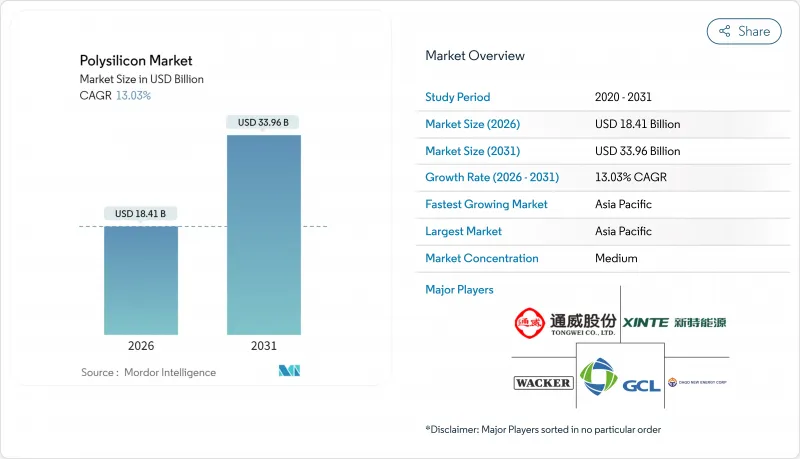
폴리실리콘 시장은 2025년 162억 9,000만 달러로 평가되었으며, 2026년 184억 1,000만 달러에서 2031년까지 339억 6,000만 달러에 이를 것으로 예상됩니다. 예측 기간(2026-2031년)의 CAGR은 13.03%를 나타낼 것으로 전망됩니다.
이러한 성장세는 급증하는 태양광 발전 설비 구축, 반도체 투자 증가, 그리고 지역 공급 다변화를 촉진하는 정책적 인센티브에서 비롯됩니다. N형 TOPCon 및 헤테로접합 셀 구조로의 급격한 전환에 의해 범용품과 프리미엄 등급의 순도 격차가 확대되는 한편, 클로즈드 루프 실리콘 재활용은 그리드 패리티 경제를 향해 꾸준히 진전하고 있습니다. 한편, 구미의 강제 노동 규제에 의해 무역 루트가 재편되어 신강산 원료 이외의 추적 가능성가 확보된 원료를 우대하는 이중 가격 환경이 태어나고 있습니다. 중국의 가동률이 40% 미만인 상황이 계속되는 가운데, 비용 압력은 여전히 강하고, 장기 반도체 계약에 의해 초고순도 생산자의 이익률은 유지되고 있는 것, 스팟 가격은 하락 경향에 있습니다.
세계 태양광 발전 설비 도입량은 2022년 191GW에서 2023년에는 444GW로 132% 급증하여 업스트림 공급망이 감소하면서 폴리실리콘 시장 수요를 강화하였습니다. 개발자들은 중국에서 2025년 6월 고정가격임베디드제도(FIT) 변경에 앞서 모듈 확보를 서두르고 원료조달 리드타임을 통상 18개월이 넘는 증산 페이스로 확대시켰습니다. 중국에서는 신규 반응로가 가동을 개시하고 있는 것, 시운전의 지연에 의해 고효율 그레이드의 재고는 희박한 상태가 계속되고 있습니다. 인도와 동남아시아의 프로젝트 계획이 공급량의 감소에 박차를 가해 현재의 가격 연조에도 불구하고, 여러 해에 걸친 성장 기반을 강화하고 있습니다. 선물계약의 동향은 미국과 유럽에서 규제 준수를 확보하기 위해 추적 가능성가 있는 신장산 이외의 소재에 대해 구매자가 여전히 프리미엄 가격을 지불할 의사가 있는 것으로 나타났습니다.
3nm 이하의 선진 로직 메모리 공장에서는 오염 허용치가 엄격화되어 기존 라인에 비해 웨이퍼 당 최대 3배의 고순도 폴리실리콘을 소비합니다. 연간 2,000억 달러가 넘는 파운드리 투자는 장기 공급 계약을 지원하고 공급업체를 태양전지 가격 변동으로부터 보호합니다. 미국 CHIPS법(520억 달러)과 EU 칩스법은 2030년까지 지역의 웨이퍼 생산량을 세계 점유율의 20%로 끌어올리는 것을 목표로 하고 있으며, 이로써 북미와 유럽에 추가적인 폴리실리콘 수요가 창출됩니다. 11N 등급의 사양을 충족하는 생산자는 태양전지 등급 제품에 비해 300-400%의 가격 프리미엄을 획득할 수 있어 마진이 확보되고 프로세스 업그레이드의 자금 조달이 가능해집니다.
중국 제조업체의 가동률은 2025년 1분기에 약 33%로 성장을 지속하여, 스팟 가격이 톤당 7만 2,100위안에서 3만 4,000위안으로 급락했기 때문에 현금 코스트를 밑도는 판매를 강요했습니다. 이 공급 과잉은 2021년부터 2023년에 걸친 생산능력 확대가 웨이퍼 라인 확장을 상회했기 때문에 폴리실리콘 시장은 2026년까지 청산가격 지향 구조에 고정될 전망입니다. 베이징의 에너지 절약 감사로 인해 소규모 반응로의 20-30%가 폐쇄될 수 있지만 그 시기는 불투명합니다. 합리화가 실현되기 전까지는 전력비용이나 TCS 비용이 높은 생산자는 마진이 마이너스가 되어 설비투자가 제약되기 때문에 단기적인 기술개수는 한정적입니다.
지멘스 공정은 2025년 기준 폴리실리콘 시장의 66.42%를 점유율을 유지하며, 태양광 및 반도체 수요처 모두가 선호하는 11N 등급 제품을 생산하고 있습니다. 그러나 원자재 가격 하락이 지속되면서 전력 소비에 대한 부담이 커지고 있으며, 지멘스 공정은 킬로그램당 60-70kWh의 전력을 소모해, 전기요금이 높은 지역에서는 수익성에 압박을 주고 있습니다. 유동층 반응기(FBR)에 의한 폴리실리콘 시장 규모는 전력 사용량이 25% 감소하고 연속 분말 배출에 의해 톤당 설비 투자가 삭감되기 때문에 14.18%의 연평균 복합 성장률(CAGR)로 급성장할 것으로 예측되고 있습니다. 청화대학의 최신연구에서는 최적화된 FBR 컬럼에서의 증착 속도가 40% 향상되는 것을 확인하여 기존 설비의 개수에 있어서 채용을 촉진하고 있습니다. 그러나 FBR 공급업체가 반도체 시장에 진입하기 위해서는 분말 오염 위험에 대한 대응이 필수적입니다. 현재, 고급 야금급 실리콘은 틈새 시장에 머물지만 캐나다와 노르웨이의 조종사는 비용 상한을 요구하는 수직 통합 웨이퍼 기업들 사이에 관심이 높아지고 있음을 보여줍니다.
전력 가격 차익거래는 전 세계 투자 패턴을 바꾸고 있습니다. 중동 프로젝트에서는 0.03달러/kWh 미만의 재생에너지를 활용해 10N급의 태양전지 원료를 타겟으로 하는 지멘스제 설비의 도입을 정당화. 한편, 미국 멕시코 걸프의 라인에서는 복합 사이클 가스 발전을 채용해, 섹션 45X세 환급 제도를 활용하고 있습니다. 환경 규제도 영향을 받고 있으며, 유럽의 금융 관계자는 라이프 사이클 CO2 공개를 요구. FBR의 저탄소 발자국이 평가되었습니다. 전체적으로 폴리실리콘 시장의 지역별 에너지 환경에서 기술 선택은 자본 지출, 운영비, 순도, 탄소 기준을 균형시키는 전략적 수단이 되고 있습니다.
아시아 태평양 지역은 2025년까지 폴리실리콘 시장의 65.70%를 차지하며 시장을 주도했는데, 이는 석영 채굴부터 모듈 조립까지 아우르는 중국의 통합 공급망 덕분입니다. 지방 정부의 인센티브 덕분에 중국의 생산 설비 용량은 40만 톤을 넘어섰지만, 만성적인 과잉 공급으로 인해 공장 가동률이 저하되고 수익성이 악화되었습니다. 인도는 전략적 수요층을 추가합니다. 2030년까지 500GW의 재생에너지 목표를 달성하기 위해서는 국내 사업이 실현되지 않는 한 연간 150킬로톤 이상의 실리콘 수입이 필요합니다. 일본과 한국은 반도체 등급 실리콘 생산에 집중하고 있으며, 오랜 기간 축적된 고순도 기술력을 활용하고 있지만, 높은 전기 요금으로 인해 기존 공장 확장에 어려움을 겪고 있습니다.
북미는 인플레이션 억제법에 의해 제조업이 재활성화되어 부흥기에 들어갔습니다. REC 실리콘의 모제스레이크 공장 재가동은 2026년까지 14킬로톤의 FBR 분말을 공급하지만 미국의 태양광 발전 설비 도입량은 연간 50GW를 넘을 수 있어 말레이시아나 독일로부터의 수입으로 보충하는 구조적 부족이 발생합니다. 섹션 301 관세와 위구르 강제 노동방지법에 근거한 압류는 물류를 복잡화시키고 추적성이 있는 화물을 위한 프리미엄 스팟 시장을 키우고 있습니다. 캐나다는 수력 발전에 의한 저탄소 전력을 제공하고 1만 톤 규모를 목표로 하는 반도체 등급 공장의 실현 가능성 조사가 진행되고 있습니다.
유럽에서는 야심적인 'Fit for 55' 목표와 평균 0.27유로/kWh(미국에 비해 2배)라는 급등한 산업용 전력요금의 균형이 과제입니다. 그러나 노르웨이의 수력 잉여를 배경으로 스코프 2 배출량 넷 제로를 목표로 하는 FBR 시설의 제안이 진행되고 있으며, 이는 EU의 모듈 구매자가 중시하는 인증 요건이 되고 있습니다.
중동 국가는 에너지 비용의 재정 거래를 추구하고 있습니다. 오만의 10만톤급 프로젝트는 0.03달러/kWh 미만의 태양광 발전과 항만의 근접성을 활용하여 아시아와 아프리카에공급을 목표로 하고 있습니다. 아프리카는 신흥 시장이며, 이집트와 모로코는 국내 태양광 목표와 연동한 제련소를 활용한 UMG(초미세립) 경로를 조사 중입니다.
The Polysilicon Market was valued at USD 16.29 billion in 2025 and estimated to grow from USD 18.41 billion in 2026 to reach USD 33.96 billion by 2031, at a CAGR of 13.03% during the forecast period (2026-2031).

This growth trajectory stems from surging solar-PV build-outs, rising semiconductor capital expenditure, and policy incentives that promote regional supply diversification. A sharp pivot toward N-type TOPCon and heterojunction cell architectures is widening the purity gap between commodity and premium grades, while closed-loop silicon recycling advances steadily toward grid-parity economics. Meanwhile, Western forced-labor rules are redrawing trade lanes, creating a dual-pricing environment that rewards traceable, non-Xinjiang feedstock. Cost pressures remain intense as Chinese utilization rates hover below 40%, depressing spot prices even as long-term semiconductor contracts preserve margins for ultra-high-purity producers.
Global PV installations accelerated from 191 GW in 2022 to 444 GW in 2023, a 132% surge that compressed upstream supply chains and fortified polysilicon market demand. Developers raced to lock in modules ahead of China's June 2025 grid-tariff shift, stretching feedstock lead times beyond typical 18-month capacity additions. Although fresh Chinese reactors are entering service, commissioning lags keep inventories thin in high-efficiency grades. Project pipelines in India and Southeast Asia compound the pull on available volumes, reinforcing a multi-year growth runway despite current price softness. Forward contract activity indicates that buyers remain willing to pay premiums for traceable, non-Xinjiang material to ensure regulatory compliance in the United States and Europe.
Advanced logic and memory fabs below the 3-nm node consume up to triple the high-purity polysilicon per wafer versus legacy lines because of tighter contamination thresholds. Annual foundry investments topping USD 200 billion underpin long-dated offtake agreements that shield suppliers from solar price volatility. The U.S. CHIPS Act (USD 52 billion) and the EU Chips Act together aim to boost local wafer output to 20% of global share by 2030, pulling incremental polysilicon tonnage into North America and Europe. Producers capable of 11N-grade specifications capture 300-400% price premiums over solar-grade parcels, cushioning margins and funding process upgrades.
Chinese producers ran at roughly 33% utilization in Q1 2025, selling below cash costs as spot prices plunged from CNY 72,100 to CNY 34,000 per ton. The glut stems from 2021-23 build-outs that outpaced wafer line expansions, locking the polysilicon market into a clearing-price mentality through 2026. Beijing's energy-efficiency audits may shutter 20-30% of sub-scale reactors, but the timing remains uncertain. Until rationalization materializes, producers with higher electricity or TCS costs face negative margins and constrained capex, limiting near-term technology retrofits.
Other drivers and restraints analyzed in the detailed report include:
For complete list of drivers and restraints, kindly check the Table Of Contents.
Siemens reactors retained a 66.42% polysilicon market share in 2025, producing 11N-grade output prized by both solar and semiconductor buyers. Yet, sustained commodity price erosion heightens focus on power consumption; Siemens lines draw 60-70 kWh per kilogram, pressuring margins in high-tariff regions. The polysilicon market size for Fluidized Bed Reactor (FBR) output is projected to surge at 14.18% CAGR, aided by 25% lower electricity use and continuous powder discharge that trims capex per tonne. Recent Tsinghua University studies confirm 40% higher deposition rates in optimized FBR columns, bolstering adoption for brownfield retrofits. Still, FBR vendors must address powder contamination risks to penetrate the semiconductor space. Upgraded metallurgical-grade silicon occupies a niche today, but pilot plants in Canada and Norway signal growing interest among vertically integrated wafer firms seeking cost ceilings.
Power-price arbitrage is shaping global investment patterns: Middle East projects leverage sub-USD 0.03/kWh renewables to justify Siemens builds targeting 10N-grade solar feedstock, while U.S. Gulf Coast lines employ combined-cycle gas to exploit Section 45X tax rebates. Environmental scrutiny also plays a role; European financiers require lifecycle CO2 disclosures, favoring FBR's lower per-kilogram carbon footprint. Overall, technology choice is becoming a strategic lever, balancing capex, opex, purity, and carbon criteria across regional energy landscapes within the polysilicon market.
The Polysilicon Market Report is Segmented by Production Process (Siemens (TCS-CVD), Fluidized Bed Reactor (Silane-FBR), Upgraded Metallurgical-Grade (UMG)), End-User Industry (Solar Photovoltaics, Electronics and Semiconductors), and Geography (Asia-Pacific, North America, Europe, South America, Middle East and Africa). The Market Forecasts are Provided in Terms of Value (USD).
Asia-Pacific dominated the polysilicon market with 65.70% revenue share in 2025, riding on China's integrated supply chain that spans quartz mining to module assembly. Provincial incentives helped Chinese nameplate capacity exceed 400 kilotonnes, yet chronic oversupply slashed plant utilization and triggered margin erosion. India adds a strategic demand layer: its 500 GW renewables target by 2030 implies annual silicon imports exceeding 150 kilotonnes unless local ventures materialize. Japan and South Korea focus on semiconductor-grade volumes, leveraging long-standing purity expertise but facing high electricity costs that hinder brownfield expansions.
North America enters a renaissance phase as the Inflation Reduction Act re-anchors manufacturing. REC Silicon's Moses Lake restart will deliver 14 kilotonnes of FBR powder by 2026, but U.S. solar installations could exceed 50 GW annually, leaving a structural deficit covered by imports from Malaysia and Germany. Section 301 tariffs and Uyghur Forced Labor Prevention Act detentions complicate logistics, fostering a premium spot market for traceable cargoes. Canada offers hydropower-driven low-carbon electricity, drawing feasibility studies for semiconductor-grade plants aiming at 10-kilotonne scales.
Europe balances ambitious Fit-for-55 targets against steep industrial power tariffs that average EUR 0.27/kWh, twice U.S. levels. Nevertheless, Norway's hydro surplus underpins proposals for FBR facilities targeting net-zero Scope 2 emissions, a credential valued by EU module buyers.
Middle East actors pursue energy-cost arbitrage: Oman's 100-kilotonne project leverages sub-USD 0.03/kWh solar power and port proximity to serve Asia and Africa. Africa remains an emerging market, with Egypt and Morocco investigating smelter-enabled UMG pathways linked to domestic solar goals.