


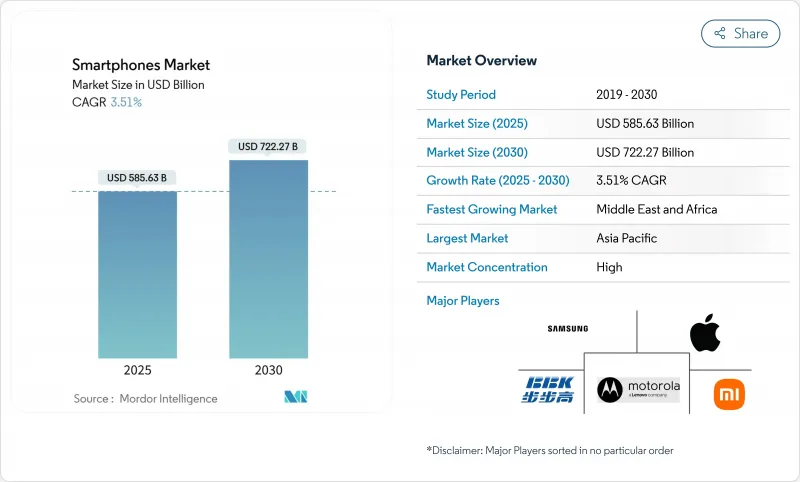
스마트폰 시장 규모는 2025년에 5,856억 3,000만 달러로 추정되고, 2030년에는 7,222억 7,000만 달러에 이를 것으로 예상되며, 예측 기간(2025-2030년)의 CAGR은 3.51%를 나타낼 전망입니다.
수익이 출하량보다 빠르게 증가하고 있는 이유는 사용자가 더 높은 메모리 구성, 멀티 카메라 어레이, 임베디드 인공지능(AI) 엔진을 선택하고 프리미엄 가격을 요구하기 때문입니다. 800달러가 넘는 가격의 기기는 전 세계 판매 대수의 소수파임에도 불구하고 업계의 이익에 차지하는 비율이 확대되고 있습니다. 아시아태평양의 스마트폰 시장 점유율은 2024년에는 56.9%에 달했지만 성장의 벡터는 다양합니다. 중국은 현재 교체 주도 시장인 반면 인도, 인도네시아, 베트남은 처음으로 스마트폰을 구입하는 층을 계속 많이 받아들이고 있습니다. 최근 소매가격과 관세 데이터를 보면 일부 신흥국에서 자국 통화가가 국내 조립을 가속화하고 있어 환율 변동에도 불구하고 엔트리 레벨 가격 설정이 안정된 것으로 나타났습니다.
스마트폰 업계는 향후 10년간 세 가지 구조적 요인에 의해 형성될 것입니다. 첫째, 전국적인 5G 커버리지가 지금까지 4G의 견고함을 누릴 수 없었던 인구가 적은 지역에도 퍼지고 있으며, 후발조가 네트워크 세대를 하나 뛰어넘을 수 있게 하고 있습니다. 둘째, 실시간 번역, 이미지 작성, 회의 메모 요약 등의 생성형 AI 기능은 클라우드 의존에서 단말기 레벨 처리로 전환하고 있으며, 신경 처리 유닛과 메모리 대역폭을 둘러싼 새로운 사양 경쟁에 불을 붙이고 있습니다. 셋째, 첨단 반도체에 대한 지정학적 제약이 각 브랜드에 부품 조달의 다양화와 공급망의 재설계를 촉구하고 있습니다. 이러한 복합적인 효과로 인해, 부문는 대형 프레임의 보급률이 성숙한 것이며, 공급업체가 기능 전개와 유연한 제조 실적를 일치시킴으로써, 여전히 수익성이 높은 틈새를 실현하고 있습니다. 2024-2025년 제품 출시 캘린더는 이러한 조정을 보여줍니다. 많은 브랜드들은 플래그쉽 도입 간격을 12개월이 아니라 약 18개월로 하고 있습니다.
5G의 보급으로 소비자가 더 높은 처리량과 낮은 지연을 요구하게 되어, 구매의 간격이 짧아지고 있습니다. 현재 세계에서 300개 가까운 상용 네트워크가 가동되고 있으며, 통신 사업자는 미드밴드 5G의 용량을 확대하기 위해 오래된 3G 주파수 대역 전환을 시작하고 있습니다. 주조 제조업체가 비용 효율적인 6nm 및 4nm 노드를 제공하고 가격에 민감한 시장에서도 주류 채택이 진행됨에 따라 디바이스의 ASP는 계속 떨어지고 있습니다. 향상된 모바일 광대역은 여전히 중심적인 이용 사례이지만, FWA 계약은 급속히 확대되고 있으며, 충분한 서비스를 받지 않은 지역에서의 디바이스 수요 증가를 지원하고 있습니다. 이 기세는 무선 액세스 투자 전체를 끌어 올리고 업그레이드 지향 사용자에게 호소하는 기능이 풍부한 미드 레인지 스마트폰의 건강한 파이프라인을 보장합니다.
인도, 인도네시아, 베트남의 가처분 소득 증가와 의욕적인 소비가 200-499달러의 달콤한 명소를 끌어올리고 있습니다. 소비자는 높은 리프레시율 OLED 패널, 멀티렌즈 이미징, 5G를 입수하기 쉬운 가격대에서 요구하고 있으며, 중국의 OEM이 적극적으로 타겟팅하고 있습니다. 인도의 평균 판매 가격은 2023년에 255달러까지 상승했고, 엔트리 디바이스로부터의 전환이 현저해졌습니다. 현지화된 온라인 채널과 타겟팅된 출시 캘린더는 축제 시즌에 맞추어 스마트폰 시장 매출에 정기적인 스파이크를 창출합니다. 그 결과, 미드프리미엄 모델이 전자상거래 플래시 이벤트에서 큰 점유율을 차지하게 되어, 네트워크 업그레이드와 디바이스 기능 수요의 사이클이 강화되고 있습니다.
인플레이션 압력과 환율 변동으로 인해 소비자는 휴대 단말기의 수명을 3년 이상으로 연장하려고 합니다. 공급업체는 7년간의 보안 업데이트를 약속하고 배터리 교체 서비스를 제공함으로써 대응하고 있지만, 전체적인 대수는 침체하고 있습니다. 정비된 스마트폰 시장은 4G 또는 5G 밴드를 지원하는 저가의 진입 단말기를 통신 사업자에게 제공함으로써 이익을 얻고 있습니다. 또한 고금리가 개발도상지역에서의 자금조달의 움직임을 둔화시켜 소매업체의 신중한 재고관리로 이어지고 있습니다. ASP는 상승하는 것, 부품 비용의 상승에 의해 마진의 확대는 억제됩니다.
2024년 판매 대수에서는 Android가 84.1%의 점유율을 유지했지만, CAGR 전망에서는 iOS가 가장 빠른 4.5%를 기록해 수익의 기세를 지원합니다. 애플이 중가격대에서의 판매를 확대하고 신흥국에서의 현지화된 결제를 지원하기 때문에 iOS 기기의 스마트폰 시장 규모는 급속히 확대될 것으로 예측됩니다. 95% 가까운 로열티가 안정적인 업그레이드 플로우를 확보하고 애플 실리콘의 지속적인 통합이 전력 효율 향상을 가져오고, 디바이스 수명을 연장하고 잔존 가치를 높입니다. 안드로이드는 완벽하게 장치에서 실행되는 Gemini AI 엔진으로 대항하여 개인 정보와 컨텍스트 인식을 향상시킵니다. OEM의 스킨은 오픈소스의 유연성을 활용하여 차별화를 도모하고 있지만, 단편화는 여전히 시기 적절한 보안 패치를 복잡하게 합니다.
애플은 새로운 SE 라인을 통해 소형 스크린 시장에 진출하고, 매크로 불황 시에 구매를 연기한 사용자의 교체 사이클을 목표로 하고 있습니다. HarmonyOS Next는 마이크로 커널 아키텍처를 채택하여 중국에서 유일한 수직 통합 대체 에코 시스템으로 화웨이를 배치했습니다. KaiOS는 비용에 민감한 시장에서 기능이 풍부한 4G 장치에 계속 적합하며 최소 메모리만 필요로 하는 음성 중심 서비스를 제공합니다. 향후 상호 운용 가능한 AI 프레임워크가 OS 경계를 모호하게 만들 수도 있지만, iOS와 Android의 확립된 용도 라이브러리는 개발자의 헌신을 계속 지원해 스마트폰 시장에서 양사의 우위를 강화할 것으로 보입니다.
2024년 출하량의 38.5%를 200달러 이하의 엔트리층이 차지했고 수백만 명에게 최초의 인터넷 액세스를 제공했습니다. 그럼에도 불구하고 울트라 프리미엄 레이어는 CAGR 6.2%로 성장을 지속하고, 소비자가 더 긴 지출을 더 긴 소유 기간에 걸쳐 상각하려는 의욕을 보여줍니다. 발매 주에는 대수 점유율이 하락함에도 불구하고 프리미엄 플래그쉽이 매출액의 최대 75%에 공헌해 공급업체의 수익성을 완화하고 있습니다. 접이식 단말기와 AI를 중심으로 한 모델은 고액의 부재가 필요함에도 불구하고 왕성한 수요를 누리고 있기 때문에 울트라 프리미엄 카테고리의 스마트폰 시장 규모는 꾸준히 확대될 것으로 예측됩니다.
200-499달러의 미드레인지 단말에는 이전에는 고가격대의 제품에만 탑재되어 있던 고해상도 디스플레이, 대형 센서, 즉각 충전이 탑재되게 되었습니다. 중국의 OEM 업체들이 화제성을 유지하기 위해 분기별로 리프레시를 실시하기 때문에 경쟁력학은 격화되고 있습니다. 브라질과 같은 시장에서는 수입 관세가 비용을 들고 구매자를 미드 프리미엄 장치의 재생 제품으로 향하게합니다. 500-799달러의 프리미엄 모델은 헬로 제품으로 작동하여 클라우드 스토리지와 같은 애프터 서비스를 수익화하는 생태계로 사용자를 유도합니다. 이러한 체인 구조는 스마트폰 시장에서 건전한 부문 수익성의 전제조건인 수량과 가치의 균형을 맞추고 있습니다.
아시아태평양은 2024년 세계 출하 대수의 56.9%를 차지해 중국과 인도의 방대한 설치 베이스와 급속한 5G 도입이 견인했습니다. 중국 국내 브랜드는 경쟁력 있는 가격 설정과 카메라의 혁신으로 점유율을 확대했고, 인도에서는 정부가 지원하는 생산 연동형 인센티브가 새로운 공장을 유치해 수입 관세를 인하했습니다. 지방의 광대역 이니셔티브가 스마트폰 시장에 처음으로 진입을 촉구하고 전반적인 보급률을 높였습니다. 보상 프로그램과 EMI 옵션은 특히 2급 도시에서의 업그레이드를 더욱 자극합니다. 현지화 의무 증가는 공급자에게 디스플레이와 배터리의 국내 조달을 촉구하고 지역 공급의 탄력성을 강화합니다. 데이터 현지화를 강화하는 규제의 움직임은 컴플라이언스 비용을 증가시킬 수 있지만 동시에 소블린 클라우드 통합을 통해 공급업체의 비즈니스 기회를 창출할 수 있습니다.
북미는 금액 기준으로는 2위이지만, 포화도가 높기 때문에 판매 대수의 성장은 둔화하고 있습니다. iOS의 점유율은 57.9%로 하드웨어, 서비스 및 컨텐츠에 걸친 생태계 통합을 반영합니다. 통신 사업자는 원격지에서 안전 기능으로 위성 메시징을 시도하고 있으며, L 밴드 링크에 대응하는 모뎀이 필요합니다. 필드 진단용 AI 대응 디바이스의 기업 채용에 의해 기업의 교체 사이클이 24개월에 가까워져, 소비자의 교체 사이클의 장기화를 일부 상쇄합니다. 미드밴드 5G의 주파수 경매가 계속되고 있으며, 네트워크의 지속적인 강화가 확보되어 호환되는 플래그십 기계에 대한 수요를 지원합니다.
중동 및 아프리카 스마트폰 시장은 2030년까지 연평균 복합 성장률(CAGR) 5.2%를 나타낼 것으로 예측됩니다. 젊은층의 인구동태, 단계적인 5G의 전개, 소구 융자 앱을 통한 단말 자금 조달의 대두가 수요를 지지합니다. 이집트는 지역 조립 허브로 부상하며 대륙 내 유통을 위한 통관상의 이점을 제공합니다. 월급날의 사이클에 맞춘 플래시 세일은 단기간의 양판에 박차를 가해 물류를 효과적으로 조정하는 브랜드에 이익을 가져옵니다. 사하라 이남의 아프리카에서는 태양광 발전 키오스크가 오프 그리드 충전을 제공하여 농촌 지역에서 장치의 실용성을 높입니다. 캐리어와 핀테크 플랫폼의 제휴로 나노크레딧이 실현되고 엔트리 레벨 스마트폰이 처음 구입하는 사람에게 합리적인 가격이 되므로 스마트폰 시장 전체의 보급이 확대됩니다.
The Smartphones Market size is estimated at USD 585.63 billion in 2025, and is expected to reach USD 722.27 billion by 2030, at a CAGR of 3.51% during the forecast period (2025-2030).
Revenue is rising more quickly than unit shipments because users are selecting higher memory configurations, multi-camera arrays, and embedded artificial-intelligence (AI) engines that command premium prices. Devices priced above USD 800 now generate a widening share of industry profit, even though they account for a minority of global volume. Asia-Pacific holds 56.9 % smartphone market share in 2024, yet growth vectors vary: China is now a replacement-driven arena, while India, Indonesia, and Vietnam continue to welcome large cohorts of first-time buyers. A review of recent retail-pricing and customs-duty data implies that local-currency weakness across several emerging economies is accelerating domestic assembly, keeping entry-level pricing stable despite exchange-rate volatility.
Three structural forces will shape the smartphone industry through the remainder of the decade. First, nationwide 5G coverage is extending into sparsely populated districts that never enjoyed robust 4G, enabling late adopters to leapfrog one network generation. Second, generative-AI functions real-time translation, image creation, and meeting-note summarization, are shifting from cloud reliance to handset-level processing, sparking a new specification race around neural-processing units and memory bandwidth. Third, geopolitical restrictions on advanced semiconductors are prompting brands to diversify component sourcing and redesign supply chains. The combined effect is a sector that, while mature in headline penetration, still delivers profitable niches when vendors align feature roll-outs with flexible manufacturing footprints. Product-launch calendars for 2024-2025 illustrate this adjustment: many brands are spacing flagship introductions by roughly eighteen months rather than twelve, a cadence that lengthens accessory-sales tails and improves return on research expenditure.
Widespread 5G availability is shortening replacement intervals as consumers seek higher throughput and lower latency. Nearly 300 commercial networks now operate worldwide, and operators have begun switching off older 3G spectrum to widen mid-band 5G capacity. Device ASPs continue to fall as foundries offer cost-efficient 6 nm and 4 nm nodes, driving mainstream adoption even in price sensitive markets. Enhanced Mobile Broadband remains the anchor use case, yet FWA subscriptions are scaling quickly and support incremental device demand in underserved rural zones. The momentum raises overall radio access investment, guaranteeing a healthy pipeline of feature rich mid-range smartphones that appeal to upgrade-minded users.
Rising disposable income and aspirational consumption in India, Indonesia, and Vietnam are lifting the USD 200-499 sweet spot. Consumers seek high refresh-rate OLED panels, multi-lens imaging, and 5G at accessible price points, a window that Chinese OEMs actively target. The average selling price in India rose to USD 255 in 2023, underscoring migration away from entry devices. Localized online channels and targeted launch calendars align with festival seasons, creating periodic spikes in smartphone market sales. Consequently, mid-premium models now account for a larger share of e-commerce flash events, reinforcing the cycle of network upgrades and device capability demand.
Inflationary pressure and currency volatility encourage consumers to extend handset life beyond three years. Vendors respond by promising seven years of security updates and offering battery replacement services, yet overall unit volumes remain subdued. The refurbished smartphone market benefits, providing operators with low-cost entry devices that still support 4G or 5G bands. High-interest rates also dampen financing uptake in developing regions, leading to cautious inventory management among retailers. Although ASPs rise, margin expansion is tempered by elevated component costs.
Other drivers and restraints analyzed in the detailed report include:
For complete list of drivers and restraints, kindly check the Table Of Contents.
Android retained 84.1% unit leadership in 2024, but iOS delivered the fastest 4.5% CAGR outlook, underpinning revenue momentum. The smartphone market size for iOS devices is expected to climb quickly as Apple widens distribution in mid-price bands and supports localized payments in emerging economies. Loyalty rates near 95% ensure stable upgrade flows, and sustained integration of Apple Silicon delivers power efficiency gains that lengthen device lifespans and boost residual values. Android counters with the Gemini AI engine running entirely on-device, enhancing privacy and context awareness. OEM skins leverage open-source flexibility to differentiate, though fragmentation still complicates timely security patches.
Apple's push into smaller-screen markets via a new SE line targets replacement cycles for users who postponed purchases during macro downturns. HarmonyOS Next adopts a microkernel architecture and positions Huawei as the only vertically integrated alternative ecosystem in China. KaiOS remains relevant for feature-rich 4G devices in cost-sensitive markets, powering voice-centric services that require minimal memory. Over the forecast horizon, interoperable AI frameworks could blur OS boundaries, but the established application libraries of iOS and Android will continue to anchor developer commitment, reinforcing their shared dominance in the smartphone market.
The entry tier below USD 200 accounted for 38.5% of shipments in 2024, providing first-time internet access to millions. Nonetheless, the ultra-premium tier generated 6.2% CAGR, underlining consumer willingness to amortize higher outlays over longer ownership spans. During launch weeks, premium flagships contribute up to 75% of revenue despite lower unit share, cushioning vendor profitability. The smartphone market size for the ultra-premium category is projected to rise steadily as foldables and AI-centric models command higher bills of materials yet enjoy robust demand.
Mid-range devices at USD 200-499 now include high-refresh displays, large sensors, and instant charging that were previously reserved for costlier products. Competitive dynamics intensify as Chinese OEMs orchestrate quarterly refreshes to preserve buzz. In markets such as Brazil, import duties inflate costs, nudging buyers toward refurbished mid-premium devices. Premium models priced at USD 500-799 serve as halo products, encouraging users into ecosystems that monetize after-sales services like cloud storage. This cascading structure balances volume and value, a prerequisite for healthy segment profitability in the smartphone market.
The Smartphone Market Report is Segmented by Operating System (Android, IOS, and More), Price Band (Entry-Level [Less Than USD 200], Mid-Range [USD 200 - 499], and More), Technology (5G, 4G/LTE, and 3G and Below), Form Factor (Bar, Foldable/Flip, and Rugged/Industrial), Distribution Channel (Operator/Carrier Stores, Brand-Owned Retail, and More) and Geography. The Market Forecasts are Provided in Terms of Value (USD).
Asia Pacific commanded 56.9% of global shipments in 2024, driven by China's and India's vast install bases and rapid 5G adoption. Domestic Chinese brands expanded their share via competitive pricing and camera innovation, while India's government-backed production-linked incentives attracted new factories that lowered import duties. Rural broadband initiatives encourage first-time smartphone market entrants, lifting overall penetration. Trade-in programs and EMI options further stimulate upgrades, particularly in tier-2 cities. Rising localization mandates push suppliers to source displays and batteries domestically, bolstering regional supply resilience. Regulatory moves to tighten data localization may increase compliance costs but also create vendor opportunities via sovereign cloud integrations.
North America ranked second by value but faces slower unit growth due to high saturation. Here, financing plans underpin premium shipments, and average selling prices are the world's highest. iOS enjoys a 57.9% share, reflecting cohesive ecosystem integration across hardware, services, and content. Carriers trial satellite messaging as a safety feature in remote areas, requiring modems capable of L-band links. Enterprise adoption of AI-enabled devices for field diagnostics keeps corporate replacement cycles closer to 24 months, partly offsetting consumer lengthening. Ongoing spectrum auctions for mid-band 5G ensure continued network enhancement, supporting demand for compatible flagships.
The Middle East & Africa smartphone market is forecast to expand at a 5.2% CAGR by 2030. Youthful demographics, gradual 5G rollout, and the rise of device financing through micro-lending apps underpin demand. Egypt is emerging as a regional assembly hub, offering customs advantages for intracontinental distribution. Flash-sale events aligned with pay-day cycles spur short bursts of volume, benefiting brands that coordinate logistics effectively. In Sub-Saharan Africa, solar-powered kiosks provide off-grid charging, increasing device utility in rural zones. Carrier partnerships with fintech platforms enable nano-credit, making entry-level smartphones affordable for first-time buyers, thereby enlarging overall smartphone market penetration.