


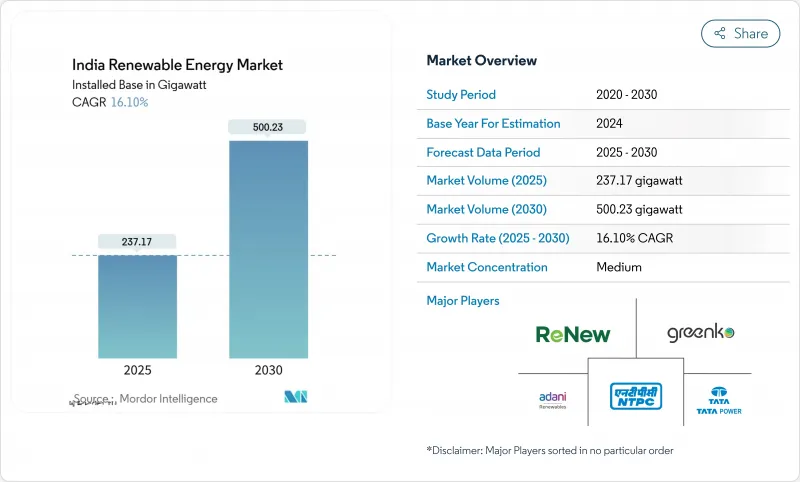
인도의 재생에너지 시장 규모는 2025년 237.17 기가와트로 평가되었고 2030년에 500.23 기가와트에 이를 것으로 예측되며, 예측 기간 중(2025-2030년) CAGR은 16.10%를 나타낼 전망입니다.

기술 비용 하락, 공격적인 입찰, PM-KUSUM 및 생산 연계 인센티브(PLI) 제도 같은 정책 도구가 규모의 경제와 비용 절감의 선순환 구조를 창출했습니다. 태양광의 확대되는 지배력, 상업·산업(C&I) 부문 조달 급증, 하이브리드+저장 장치 입찰의 확대되는 파이프라인이 경쟁 역학을 재정의하며 기록적인 자본 유입을 촉진하고 있습니다. 동시에 전력망 병목 현상, DISCOM(전력 유통사)의 지불 지연, 핵심 광물 의존도는 해결되지 않을 경우 성장 모멘텀을 저해할 위험이 있습니다. 그럼에도 불구하고 인도 재생에너지 시장은 최근 정상회담에서 발표된 860억 달러 규모의 신규 투자 약속으로 입증된 바와 같이 강력한 투자자 신뢰를 지속적으로 보여주고 있습니다.
생산연계인센티브(PLI) 지원 모듈 생산과 기술 발전에 힘입어 태양광 발전 단가가 2.51루피/kWh라는 사상 최저치를 달성했으며, 이로 인해 수입 의존도가 2020년 90%에서 2025년 60% 미만으로 감소할 전망입니다. 풍력 발전 비용 추세도 유사하지만 속도는 더딘 편입니다. 다만 2MW 미만 터빈의 25.4GW 규모 리파워링 잠재력이 추가적인 비용 최적화를 가능케 합니다. 태양광, 풍력, 석탄의 비용 곡선이 교차하는 전환점이 도래하여 재생에너지 신규 설비가 이제 신규 용량 확보의 기본 선택지가 되었습니다.
인도 태양에너지공사(SECI) 및 주정부 기관들은 2024년 상반기 7.6GW 규모의 입찰을 공고했으며, 이는 전년 동기 대비 191% 증가한 수치입니다. 동시에 진화하는 입찰 구조는 전력망 통합 강화를 위해 에너지 저장 장치 및 국내 생산품 사용을 요구하고 있습니다. 2026년까지 132.7GW 규모의 프로젝트 가시성이 확보되면서 개발사들은 제조 시설 확대 및 프로젝트 파이프라인 확장에 대한 확신을 얻고 있습니다.
여러 주에서 20%를 초과하는 배전 손실이 지속되면서 DISCOM의 유동성이 계속 악화되고 있습니다. 이는 지불 보증 메커니즘에도 불구하고 지불 지연을 초래하고 신규 프로젝트 추진을 위축시키고 있습니다. 요금 설정 구조 개혁과 보조금 합리화는 여전히 필수적입니다.
2024년 태양광 발전 용량은 114GW로 인도 재생에너지 시장의 48%를 차지했습니다. 2030년까지 태양광의 연평균 성장률(CAGR) 17%는 태양광 단독으로 인도 재생에너지 시장 규모를 254GW까지 끌어올릴 것으로 예상됩니다. 생산연계보조금(PLI) 시행 이후 국내 모듈 생산량은 2021년 10GW에서 2024년 77.2GW로 증가했으며, 풍력은 47.36GW로 안정적이지만 노후화된 프로젝트에 대한 리파워링 요구에 직면해 있습니다. 수력발전은 51.99GW, 바이오매스는 11.32GW를 기여하며 기저부하 지원을 제공합니다. 2026년 4월부터 시행되는 국내 셀 의무 사용 규정은 현재 7.6GW인 셀 생산 능력을 다중으로 확대해야 할 필요성을 제기합니다. 구자라트주는 모듈 생산량의 45%, 셀 생산라인의 52%를 차지하며, 물류 비용과 수출 시간을 단축하는 공급망 클러스터를 형성하고 있습니다.
2023년 태양광 수출이 3GW로 급증하며(주로 미국으로) 글로벌 경쟁력 상승을 입증했습니다. 풍력 개발사들은 25GW 규모의 2MW 미만 터빈 교체를 위해 대형 터빈을 도입 중이며, 태양광-풍력-저장 복합발전소는 24시간 전력 공급이 요구되는 입찰에서 우위를 점하고 있습니다. 지열 및 조력 기술은 초기 단계이지만 연구개발 지원금의 혜택을 받고 있습니다.
인도의 재생가능에너지 시장 보고서는 공급원별(태양광, 풍력, 수력, 바이오에너지, 기타 재생가능에너지), 최종 용도부문별(유틸리티, 상업·공업, 주택, R&농업)으로 분류되어 있습니다. 시장 규모와 예측은 설치 용량(GW)으로 제공됩니다.
The India Renewable Energy Market size in terms of installed base is expected to grow from 237.17 gigawatt in 2025 to 500.23 gigawatt by 2030, at a CAGR of 16.10% during the forecast period (2025-2030).
Declining technology costs, aggressive auctions, and policy tools such as PM-KUSUM and the Production-Linked Incentive (PLI) scheme have created a self-reinforcing cycle of scale and cost reduction. Solar's expanding dominance, commercial and industrial (C&I) procurement surge, and a widening pipeline of hybrid-plus-storage tenders are redefining competitive dynamics and spurring record capital inflows. At the same time, grid bottlenecks, DISCOM payment delays, and critical-mineral exposure threaten to temper momentum if left unresolved. Nevertheless, the India renewable energy market continues to demonstrate strong investor confidence, underscored by USD 86 billion in fresh commitments announced at recent summits .
Record solar tariffs of INR 2.51/kWh have been achieved on the back of PLI-supported module production and technology gains, reducing import dependence from 90% in 2020 to below 60% in 2025. Wind's cost trajectory is similar, though slower, yet 25.4 GW of repowering potential for sub-2 MW turbines offers further cost optimization. The merging of solar, wind, and coal cost curves has reached a tipping point where renewable additions are now the default choice for new capacity.
Solar Energy Corporation of India (SECI) and state agencies issued 7.6 GW of tenders in H1 2024, 191% higher year-on-year, while evolving bid structures now require storage and domestic content to enhance grid integration . Visibility of 132.7 GW of projects through 2026 gives developers confidence to expand manufacturing and project pipelines.
Distribution losses above 20% in several states continue to erode DISCOM liquidity, delaying payments and discouraging new projects despite payment-security mechanisms . Structural reforms in tariff setting and subsidy rationalization remain essential.
Other drivers and restraints analyzed in the detailed report include:
For complete list of drivers and restraints, kindly check the Table Of Contents.
Solar capacity stood at 114 GW in 2024, representing 48% of the India renewable energy market. Solar's 17% CAGR to 2030 is expected to raise the India renewable energy market size for solar alone to 254 GW. Domestic module output climbed from 10 GW in 2021 to 77.2 GW in 2024 after the PLI outlay, while wind remains steady at 47.36 GW, yet faces a repowering requirement for aging projects. Hydro contributes 51.99 GW and biomass 11.32 GW, supplying baseload support. A mandatory domestic-cell rule from April 2026 will necessitate a many-fold expansion of the current 7.6 GW cell capacity. Gujarat hosts 45% of modules and 52% of cell lines, fostering a supply-chain cluster that cuts logistics costs and export times.
Solar's export surge to 3 GW in FY 2023, mainly to the United States, underlines rising global competitiveness. Wind developers pursue larger turbines to replace 25 GW of sub-2 MW units, while hybrid solar-wind-storage plants win tenders that demand round-the-clock profiles. Geothermal and tidal technologies remain nascent but benefit from supportive R&D grants.
The India Renewable Energy Market Report is Segmented by Source (Solar, Wind, Hydro, Bioenergy, and Other Renewables), End-Use Sector (Utilities, Commercial and Industrial, Residential, R and Agricultural). The Market Size and Forecasts are Provided in Terms of Installed Capacity (GW).