North America Silica Sand - Market Share Analysis, Industry Trends & Statistics, Growth Forecasts (2025 - 2030)
상품코드:1693892
리서치사:Mordor Intelligence
발행일:2025년 03월
페이지 정보:영문
라이선스 & 가격 (부가세 별도)
ㅁ Add-on 가능: 고객의 요청에 따라 일정한 범위 내에서 Customization이 가능합니다. 자세한 사항은 문의해 주시기 바랍니다.
ㅁ 보고서에 따라 최신 정보로 업데이트하여 보내드립니다. 배송기일은 문의해 주시기 바랍니다.
한글목차
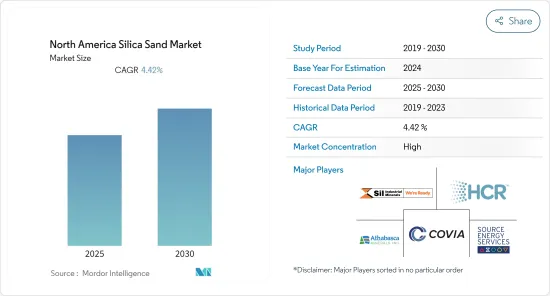
북미 규사 시장은 예측 기간 동안 CAGR 4.42%를 기록할 전망
주요 하이라이트
COVID-19 팬데믹은 여러 산업에 악영향을 미쳤습니다.
북미의 유리 제조 산업 수요 증가와 주조 산업의 소비는 조사 시장의 성장을 가속하는 주요 요인입니다.
그러나, 모래의 불법 채굴과 규사 대체품의 입수 가능성은 조사 시장의 성장을 억제할 가능성이 높습니다.
치과나 생명공학에서 모래를 이용한 치료의 개발은 조사 시장에 유리한 성장 기회를 가져올 가능성이 높습니다.
미국은 석유 및 가스와 유리 제조 산업에서의 규사 소비가 가장 많기 때문에 이 지역에서 최대의 규사 시장을 차지하고 있습니다.
북미 규사 시장 동향
석유 및 가스산업이 시장을 독점
규사는 '수압 파쇄 모래'라고도 불리며, 이는 석유 및 가스 회사가 혈암과 같은 비재래형 저침투성 저류층으로부터 천연가스, 천연가스액, 석유를 생산하기 위해서 사용하는 수압 파쇄 방식에 사용되는 것에 유래합니다.
규사는 천연가스, 석유, 천연가스 액체를 암석의 구멍에서 추출하기 위해 혈암을 파쇄하는 과정에서 필수적입니다. 백사는 균열을 열기 위해 사용되는 경우 프로판트라고 불립니다.
미국과 캐나다는 세계 최대의 석유 및 가스 생산국 중 하나입니다. 캐나다는 세계 제4위의 석유 생산국입니다.
Energy Institute Statistical Review of World Energy 2023에 따르면, 2022년 캐나다의 석유 생산량은 2억 7,400만 톤으로 세계 점유율의 6.2%를 차지하였습니다.
게다가, 캐나다 석유생산자협회에 따르면 캐나다 내 지출은 2023년에 400억 달러로 증가해 2022년 대비 11% 증가하였습니다.
북미 내 원유와 액체 연료의 총 생산량은 2021년의 2,644만 배럴/일에 비해 2022년에는 2,781만 배럴/일을 기록했습니다.
미국은 비재래형 원유 매장량의 탐사 분야에서 세계 유수의 국가이며, 이는 미국이 조사 시장에서 큰 기회를 제공함을 나타내고 있습니다.
미국은 세계 최대의 석유 및 가스 소비국 중 하나이며 수출국이기도 합니다. 미국의 원유 생산량은 2022년에는 2021년에 비해 70만 b/d 증가했습니다. 또한 2023년의 생산량은 1,280만b/d를 넘어, 2019년에 기록한 1,230만b/d의 연간 평균 기록을 갱신하였습니다.
이 지역에서의 석유 및 가스 생산의 꾸준한 성장을 고려하면, 규사 수요는 예측 기간 중에 확대될 가능성이 높습니다.
미국이 지역 시장을 독점
석유 및 가스 산업은 미국 내 규사의 주요 소비 부문입니다. 미국 에너지 정보국에 따르면 2022년의 원유 생산량은 평균 1,190만 bpd를 기록하였으며 2023년에는 1,241만 B/D, 2024년에는 1,280만 B/D를 기록하였습니다.
미국에서는 최근, 홀그레인 실리카 수요가 증가하고 있습니다.
건설 산업은 규사의 최대 소비 부문 중 하나입니다. 규사의 물리적 성질은 통상의 건설용 모래와는 다릅니다.
또한 미국 인구조사국이 작성한 통계에 따르면 2021년에 1조 5,000억 달러였던 미국의 신축 연간 건설액은 2022년에는 1조 6,600억 달러에 달하였습니다.
미국 내 주택 건설의 연간 금액은 2021년의 7억 4,065만 달러에서 2022년에는 8억 4,916만 달러를 기록하였습니다.
주조 모래는 철과 비철 금속 주물의 주형이나 중자를 제조하기 위해서 사용되는 높은 점도를 가지는 균일한 규사입니다. 통상, 80% 이상의 고품질 규사, 5-10%의 벤토나이트 점토, 2-5%의 물, 5% 이하의 해탄으로 구성되어 있습니다. 따라서 주조 산업에서는 결함이 없고 표면 마무리가 뛰어난 완성도 높은 주조품을 제조할 수 있습니다.
미국에서는 건설산업의 성장과 함께 세라믹 산업도 급성장이 예상되고 있습니다. 미국 상무부와 미국타일협회(TCNA)에 따르면, 2022년 미국의 세라믹 타일 소비량은 2억 8,540만 평방미터를 기록하였습니다. 2022년 내수 타일 생산량은 약 8,730 평방미터였으며 2021년에 비해 2.3% 증가하였습니다.
그 결과, 이 나라의 다양한 최종 사용자 산업에서 발생하는 수요와 성장을 고려하면, 미국의 규사 시장은 향후 수년간 안정된 성장을 이룰 것으로 예측됩니다.
북미의 규사 산업 개요
북미의 규사 시장은 통합되어 있습니다. 주요 기업으로는 Covia Holdings LLC, Hi-Crush Inc., Source Energy Services Ltd., Sil Industrial Minerals, Athabasca Minerals Inc.(순서부동) 등이 있습니다.
기타 혜택
엑셀 형식 시장 예측(ME) 시트
3개월간 애널리스트 서포트
목차
제1장 서론
조사의 전제조건
조사 범위
제2장 조사 방법
제3장 주요 요약
제4장 시장 역학
성장 촉진요인
유리 산업에서의 수요 증가
주조 산업에서의 소비 증가
기타 촉진요인
억제요인
대체품의 이용 가능성
불법 모래 채굴
산업 밸류체인 분석
Porter's Five Forces 분석
공급기업의 협상력
구매자의 협상력
신규 참가업체의 위협
대체품의 위협
경쟁도
제5장 시장 세분화
최종 사용자 산업
유리 제조
주조
화학 제조
건설업
페인트 및 코팅
세라믹과 내화물
여과
석유 및 가스 회수
기타 최종 사용자 산업(식품 가공, 산업용 연마재, 스포츠 부문)
지역
미국
캐나다
멕시코
제6장 경쟁 구도
M&A, 합작사업, 제휴, 협정
시장 점유율(%)**/랭킹 분석
주요 기업의 전략
기업 프로파일
Athabasca Minerals Inc.
Atlas Sand Company, LLC
Badger Mining Corporation
Capital Sand Company
Covia Holdings LLC
Hi-Crush Inc.
Sibelco
Signal Peak Silica LLC
Sil Industrial Minerals
Source Energy Services Ltd.
Superior Silica Sands
US Silica
제7장 시장 기회와 미래 동향
수처리 산업에서의 미래 기회
치과와 생명 공학에서 모래를 사용한 치료 개발
CSM
영문 목차
영문목차
The North America Silica Sand Market is expected to register a CAGR of 4.42% during the forecast period.
Key Highlights
The COVID-19 pandemic affected several industries negatively. The lockdown in most countries in North America caused disruptions in infrastructure and construction activities, mining operations, and freight transportation which disturbed the supply chain. However, the conditions started recovering in 2021, restoring the market's growth trajectory.
The growing demand from the glass production industry in North America and consumption in the foundry industry are major factors driving the growth of the market studied.
However, the illegal mining of sand and the availability of substitutes for silica sand are likely to restrain the growth of the studied market.
Nevertheless, the development of sand-based treatments in dentistry and biotechnology is likely to create lucrative growth opportunities for the studied market.
The United States represents the largest market for silica sand in the region owing to the highest consumption of silica sand from the oil and gas and glass production industries.
North America Silica Sand Market Trends
Oil and Gas Industry to Dominate the Market
Silica sand, also known as "frac sand," comes from its use in hydraulic fracturing, a completion method used by oil and gas companies to produce natural gas, natural gas liquids, and oil from unconventional, low permeability reservoirs such as shale.
Silica sand is essential in the process of fracturing shale to release natural gas, oil, and natural gas liquids from pores in the rock. When the high-pressure water stream forces the small perforations to become larger fractures, fracking sand keeps these fractures open to continue releasing fossil fuels. When white sand is used to prop open these fractures, it is referred to as a proppant. The longer the proppant can withstand the enormous pressure of the fractures. The more petroleum can be extracted, maximizing the well's efficiency.
The United States and Canada are among the world's largest Oil and Gas producers. Canada is the world's fourth-largest producer of oil. The Canadian oil and gas industry has direct and indirect operations (including offshore) in twelve provinces and territories.
According to the Energy Institute Statistical Review of World Energy 2023, Canada's oil production in 2022 was 274 million tonnes, accounting for 6.2% of the global share. Further, this represents a nearly 2.8% increase in production over the previous year.
Additionally, according to the Canadian Association of Petroleum Producers, spending in Canada is expected to rise to USD 40 billion in 2023, 11% more compared to 2022. Oil sands investment for 2023 is expected to reach USD 11.5 billion, whereas conventional oil and natural gas capital investment is projected at USD 28.5 billion.
The total production of crude oil and liquid fuels in North America was 27.81 million barrels per day in 2022, compared to 26.44 million barrels per day in 2021.
The United States is one of the leading countries globally in the exploration of unconventional crude oil reserves, indicating a massive opportunity for the studied market in the country.
The United States is one of the world's largest consumers and exporters of oil and gas. According to U.S. Energy Information Administration (EIA), crude oil production in the United States was an average of 11.9 million barrels per day (b/d) in 2022, up 0.7 million b/d from 2021. Also, the output will is expected to exceed 12.8 million b/d in 2023, breaking the previous annual average record of 12.3 million b/d set in 2019.
Considering the steady growth of oil and gas production in the region, the demand for silica sand is likely to grow during the forecast period.
United States to Dominate the Regional Market
The oil and gas industry is the country's major consumer of silica sand. According to the US Energy Information Administration, the crude oil output was 11.9 million bpd (barrels per day) in 2022. This is estimated to average 12.41 million bpd by 2023 and 12.8 million bpd in 2024. With the increase in heat consumption by the population and to meet the industrial requirement, the demand is expected to surge.
The demand for whole-grain silica has increased in the United States in recent years. The market for whole-grain silica is being boosted by the development of new roads and buildings.
The construction industry is one of the largest consumers of silica sand. The physical properties of silica sands are different from the normal construction sands. The properties of silica sand include the combination of chemical and physical properties, such as high silica content and very low levels of deleterious impurities, for which the demand for silica sand has been increasing in the construction industry in recent times.
Additionally, as per further statistics generated by the US Census Bureau, the annual value for new construction put in place in the United States accounted for USD 1.66 trillion in 2022, compared to USD 1.50 trillion in 2021.
The annual value of residential construction put in place in the United States was valued at USD 849.16 million in 2022, compared to USD 740.65 million in 2021. The annual value of non-residential construction put in place in the country was valued at USD 808.43 million in 2022, compared to USD 759.18 million in 2021, thereby increasing the consumption of silica sand in the short term.
Foundry sand is a uniform silica sand of high consistency that is used to produce molds and cores for ferrous and nonferrous metal castings. It typically comprises more than 80% high-quality silica sand, 5-10% bentonite clay, 2 to 5% water, and less than 5% sea coal. Because of the high silica levels of silica sand, the foundry industry can produce high-integrity castings, free of defects and with superior surface finishes. The rising demand for steel and aluminum in various industries, including automotive, construction, and electronics, is projected to boost the consumption of silica sand in the foundry.
With the growing construction industry, the ceramic industry in the country is expected to grow rapidly. According to the US Department of Commerce and Tile Council of North America (TCNA), total ceramic tile consumption in the United States was 285.4 million square meters in 2022. The volume of domestically produced tile was around 87.3 million square meters in 2022, up 2.3% in 2021.
Consequently, given the demand and growth across various end-user industries in the country, the silica sand market in the United States is forecasted to witness steady growth in the coming years.
North America Silica Sand Industry Overview
The North America silica sand market is consolidated in nature. The major players (not in any particular order) include Covia Holdings LLC, Hi-Crush Inc., Source Energy Services Ltd., Sil Industrial Minerals, and Athabasca Minerals Inc., among others.
Additional Benefits:
The market estimate (ME) sheet in Excel format
3 months of analyst support
TABLE OF CONTENTS
1 INTRODUCTION
1.1 Study Assumptions
1.2 Scope of the Study
2 RESEARCH METHODOLOGY
3 EXECUTIVE SUMMARY
4 MARKET DYNAMICS
4.1 Drivers
4.1.1 Growing Demand from the Glass Industry
4.1.2 Increasing Consumption in the Foundry Industry
4.1.3 Other Drivers
4.2 Restraints
4.2.1 Availability of Substitutes
4.2.2 Illegal Mining of Sand
4.3 Industry Value Chain Analysis
4.4 Porter's Five Forces Analysis
4.4.1 Bargaining Power of Suppliers
4.4.2 Bargaining power of Buyers
4.4.3 Threat of New Entrants
4.4.4 Threat of Substitute Products and Services
4.4.5 Degree of Competition
5 MARKET SEGMENTATION (Market Size in Volume)
5.1 End-User Industry
5.1.1 Glass Manufacturing
5.1.2 Foundry
5.1.3 Chemical Production
5.1.4 Construction
5.1.5 Paints and Coatings
5.1.6 Ceramics and Refractories
5.1.7 Filtration
5.1.8 Oil and Gas Recovery
5.1.9 Other End User Industries (Food Processing, Industrial Abrasives and Sports Fields)
5.2 Geography
5.2.1 United States
5.2.2 Canada
5.2.3 Mexico
6 COMPETITIVE LANDSCAPE
6.1 Merger & Acquisitions, Joint Ventures, Collaborations, and Agreements
6.2 Market Share (%)**/Ranking Analysis
6.3 Strategies Adopted by Leading Players
6.4 Company Profiles
6.4.1 Athabasca Minerals Inc.
6.4.2 Atlas Sand Company, LLC
6.4.3 Badger Mining Corporation
6.4.4 Capital Sand Company
6.4.5 Covia Holdings LLC
6.4.6 Hi-Crush Inc.
6.4.7 Sibelco
6.4.8 Signal Peak Silica LLC
6.4.9 Sil Industrial Minerals
6.4.10 Source Energy Services Ltd.
6.4.11 Superior Silica Sands
6.4.12 U.S. Silica
7 MARKET OPPORTUNITIES AND FUTURE TRENDS
7.1 Future Opportunities in the Water Treatment Industry
7.2 Development of Sand-based Treatments in Dentistry and Biotechnology