ㅁ Add-on 가능: 고객의 요청에 따라 일정한 범위 내에서 Customization이 가능합니다. 자세한 사항은 문의해 주시기 바랍니다.
ㅁ 보고서에 따라 최신 정보로 업데이트하여 보내드립니다. 배송기일은 문의해 주시기 바랍니다.
한글목차
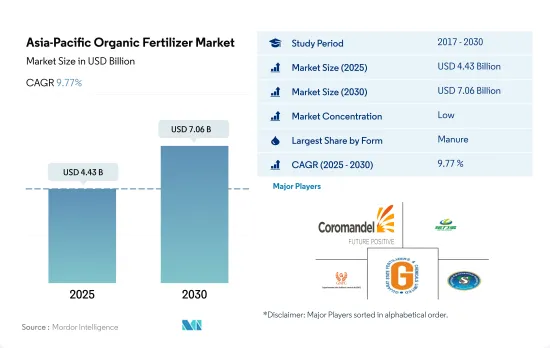
아시아태평양의 유기 비료 시장 규모는 2025년에 44억 3,000만 달러에 이르고, 2030년에는 70억 6,000만 달러에 달할 것으로 예상되며, 예측 기간 중(2025-2030년) CAGR은 9.77%를 나타낼 것으로 전망됩니다.
유기 비료는 아시아태평양에서 농업용 생물 비료 중 가장 많이 소비되는 비료입니다. 유기 비료는 2022년에 아시아태평양 농업용 생물제제 시장액의 약 45.8%를 차지했는데, 이는 주로 유기 농업과 프랙티스 농업에서 대량으로 사용되었기 때문입니다.
이 지역에서는 주로 농작물, 환금작물, 과일·야채 등 모든 유형의 작물에 적합하기 때문에 프랙티스 농법과 유기농법 모두에서 싶은 비의 이용이 우세하고, 2022년 시장 규모는 16억 7,000만 달러였습니다. 비료는 또한 씨앗을 뿌리기 전에 토양의 물리 화학적 특성을 개선하는 데 사용되며, 필요에 따라 작물의 다양한 성장 단계에서도 사용됩니다.
식사 기반 유기 비료 소비는 2022년 9억 2,740만 달러로 평가되었습니다. 이 비료는 비료에 비해 높은 영양분을 함유하고 있습니다. 혈분이나 각분과 같은 밀 기반 비료는 다른 밀 기반 비료에 비해 인 함량이 높고 환금 작물에 이상적입니다.
2022년 석유 유기 비료 소비는 1,870만 달러로 평가되었습니다. 이 비료는 영양분의 방출이 느리기 때문에 원예 작물에 이상적입니다.
인도와 중국과 같은 이 지역의 주요 농업국은 유기농업과 지속가능한 농업투입물의 적용을 촉진하는 다양한 프로그램과 체계를 개시하고 있습니다.
아시아태평양은 세계의 유기농업과 유기 비료 시장에서 급속히 핫스팟이 되고 있습니다. 되고 있습니다.중국과 인도는 유기 생산의 리더로서 대두해 왔습니다.
이 지역에서는 지난 몇 년간 유기농업면적이 대폭 증가하고 있으며, 2017년 490만 헥타르에서 2021년에는 690만 헥타르로 확대되었습니다.
아시아태평양의 대부분의 국가에서는 연작 작물이 우세하고 유기 작물 총 면적의 약 67.7%를 차지하고 있습니다.
다양한 정부기관이 유기비료에 대한 장려금 지급 등 다양한 제도와 프로그램을 통해 유기농법과 지속가능농농법을 장려하고 있습니다.
아시아태평양은 유기농업과 유기 비료 시장의 대폭적인 성장을 목격하고 있습니다.
아시아태평양의 유기 비료 시장 동향
중국, 인도, 인도네시아, 호주 등 국가의 정부 지원 확대가 이 지역의 유기농업을 뒷받침
FiBL의 통계에 따르면 아시아태평양의 유기농지면적은 2021년에는 370만ha를 넘어 세계의 유기농지면적의 26.4%를 차지했습니다. 중국, 인도, 인도네시아, 호주는 이 지역에서 유기농 면적이 큰 주요 국가입니다. Krishi Vikas Yojana나 All India Network Programme on Organic Farming(AI-NPOF)과 같은 제도를 실시했습니다.
2021년에는 중국이 250만 ha로 66.1%의 최대 점유율을 차지한 다음 인도가 19.3%, 인도네시아가 1.5%, 호주가 1.4%였습니다. 연작 작물은 이 지역의 유기농지의 67.5%, 즉 250만ha를 차지하고, 큰 점유율을 차지하고 있습니다.
환금작물의 점유율은 2위로 2021년에는 70만ha가 되어 유기농지의 18.5%를 차지했습니다.
유기농 제품에 대한 1인당 지출은 호주가 압도적으로 많아 중국의 유기농 식품 시장이 크게 성장
이 지역의 유기농 제품에 대한 1인당 지출은 2021년에는 85.1달러를 기록했습니다. Global Organic Trade의 데이터에 의하면, 호주의 유기 포장 식품 시장은 2021년에는 8억 8,520만 달러에 달했습니다.
중국의 유기농 식품 시장은 2021년에 13.3% 성장하여 2023-2029년에 걸쳐 CAGR은 7.1%를 나타내 성장 패턴이 계속될 것으로 예측됩니다. 또한 어머니의 취업수 증가와 건강과 웰니스 동향 채용 증가로 유기농 아기 식품 수요가 높아지고 있기 때문에 유기농 제품은 2025년까지 64억 달러 규모에 이를 것으로 예측됩니다.
인도의 유기농 제품은 세계 수요의 1.0%에 멀리 미치지 못하고 2021년 1인당 지출액은 불과 0.08달러였습니다. 전문점만이 오가닉 상품을 판매하고 있습니다. 소비자의 지식의 증대와 구매 패턴의 변화에 의해 이 지역의 유기 식품의 지속가능성에 대한 이해가 깊어질 가능성이 있습니다.
아시아태평양의 유기 비료 산업 개요
아시아태평양의 유기 비료 시장은 세분화되어 있으며 상위 5개 기업에서 6.60%를 차지하고 있습니다. 이 시장의 주요 기업은 Coromandel International Ltd. 등이 있습니다.
기타 혜택
엑셀 형식 시장 예측(ME) 시트
3개월의 애널리스트 서포트
목차
제1장 주요 요약과 주요 조사 결과
제2장 보고서 제안
제3장 서론
조사의 전제조건과 시장 정의
조사 범위
조사 방법
제4장 주요 산업 동향
유기 재배 면적
1인당 유기농 제품에 대한 지출
규제 프레임워크
호주
중국
인도
인도네시아
일본
필리핀
태국
베트남
밸류체인과 유통채널 분석
제5장 시장 세분화
형태
분뇨
식사 기반 비료
오일 케이크
기타 유기 비료
작물 유형
환금작물
원예작물
경작작물
생산국
호주
중국
인도
인도네시아
일본
필리핀
태국
베트남
기타 아시아태평양
제6장 경쟁 구도
주요 전략 동향
시장 점유율 분석
기업 상황
기업 프로파일
Biolchim SpA
Coromandel International Ltd
Deepak Fertilisers & Petrochemicals Corp. Ltd
Genliduo Bio-tech Corporation Ltd
Gujarat Narmada Valley Fertilizers & Chemicals Ltd
The Asia-Pacific Organic Fertilizer Market size is estimated at 4.43 billion USD in 2025, and is expected to reach 7.06 billion USD by 2030, growing at a CAGR of 9.77% during the forecast period (2025-2030).
Organic fertilizers are the most consumed fertilizers in Asia-Pacific under agricultural biologicals. Organic fertilizers accounted for about 45.8% of the Asia-Pacific agriculture biologicals market value in 2022, mainly due to their application in bulk quantities in organic and conventional farming.
Manure application was dominant in the region, valued at USD 1.67 billion in 2022, mainly due to its suitability to all types of crops, including field crops, cash crops, and fruits and vegetables, both in conventional and organic farming. Manures are also used to improve the physio-chemical properties of the soil before taking up the seed sowing and even at different growth stages of the crop based on the requirement.
The consumption of meal-based organic fertilizers was valued at USD 927.4 million in 2022. These fertilizers have high nutrient content compared to manures. Meal-based fertilizers like blood and horn meal have higher phosphorus content compared to other meal-based fertilizers, and they are best suited for cash crops.
The consumption value of oil cake organic fertilizers was valued at USD 18.7 million in 2022. These fertilizers are best suited in horticultural crops due to their slow release of nutrients.
Major agricultural countries in the region, like India and China, have initiated various programs or schemes promoting organic farming and the application of sustainable agricultural inputs. The growing organic crop cultivation areas and the rising demand for organic commodities may drive the Asia-Pacific organic fertilizer market between 2023 and 2029.
The Asia-Pacific region is rapidly becoming a hotspot in the global organic farming and organic fertilizer market. Major organic crops, like rice, sugarcane, and fresh fruits and vegetables, are grown across the region. China and India are emerging as leaders in organic production. While these two countries have a higher area under organic farming, it still accounts for less than 2.0% of the total agricultural area in these countries.
The region has seen a significant increase in organic farming area over the last few years, growing from 4.9 million hectares in 2017 to 6.9 million hectares in 2021. This rising trend is driving the demand for organic fertilizers, which is estimated to increase by 73.1% by 2029.
Row crops dominate most countries in the Asia-Pacific region, accounting for about 67.7% of the total organic crop area. This dominance resulted in row crops having the highest consumption of organic fertilizers, accounting for a 79.7% share of the Asia-Pacific region's consumption by value in 2022.
Various government bodies are encouraging organic or sustainable farming methods through various schemes or programs, including offering incentives for organic fertilizers. This trend is expected to drive the demand for organic fertilizers in the region.
The Asia-Pacific region is witnessing substantial growth in the organic farming and organic fertilizer market. The region's increasing organic farming area, combined with various government incentives, is expected to drive the demand for organic fertilizers in the region between 2023 and 2029.
Asia-Pacific Organic Fertilizer Market Trends
Growing government support in countries like China, India, Indonesia, and Australia, boosts organic farming in the region
The area of organic agricultural land in Asia-Pacific was over 3.7 million ha in 2021, representing 26.4% of the global organic area, as per FiBL statistics. The organic area under cultivation grew by 19.3% between 2017-2022. As of 2020, the region had 1.83 million organic producers, with India topping the list with 1.3 million organic producers. China, India, Indonesia, and Australia are the major countries with large organic cultivation areas in the region. Government authorities in countries like China and India are constantly promoting organic agriculture to reduce reliance on chemical inputs for crop cultivation. For instance, India has implemented schemes like Paramparagat Krishi Vikas Yojana and the All India Network Programme on Organic Farming (AI-NPOF).
In 2021, China accounted for a maximum share of 66.1%, with 2.5 million ha, followed by India, Indonesia, and Australia, with 19.3%, 1.5%, and 1.4%, respectively. The total organic land is divided into three crop types, namely row crops, horticultural crops, and cash crops. Row crops occupy a major share of organic agricultural land in the region, accounting for 67.5% share, i.e., 2.5 million ha in 2021. The major row crops grown in the region include paddy, wheat, pulses, soybeans, and millets.
Cash crops held the second largest share, with 0.7 million ha in 2021, accounting for an 18.5% share of organic cropland. The demand for organic cash crops like sugar and organic tea is increasing worldwide. China and India are the largest organic green and black tea producers, respectively. The growing international demand is expected to increase the organic acreages in the region.
Per capita spending on organic product predominant in Australia and China's organic food market growing significantly
The per capita spending on organic products in the region was recorded at USD 85.1 in 2021. Australia witnessed a higher per capita spending on organic products, with USD 58.3 in the same year, attributed to the higher demand due to consumers' perception of organic food as healthy. As per the Global Organic Trade data, the organic packaged food and beverage market in Australia was valued at USD 885.2 million in 2021.
China's organic food market grew by 13.3% in 2021, and the positive growth pattern is expected to continue, with a CAGR of 7.1% between 2023 and 2029. With an increasing emphasis on the importance of organic products among the younger generation and the rising demand for organic baby food due to the growing number of mothers in the workforce and the increasing adoption of the health and wellness trend, organic products are expected to reach a value of USD 6.4 billion by 2025.
Organic products in India represent far less than 1.0% of global demand, with a per capita expenditure of just USD 0.08 in 2021. However, the Indian market may grow over the coming years, reaching a value of USD 153.3 million by 2025. Currently, the region's organic goods market is highly fragmented, with just a few supermarkets and specialty stores selling them, as people from higher-income families are the only potential customers. Growing consumer knowledge and changing buying patterns may lead to a better understanding of organic food sustainability in the region. Increasing per capita income and increased consumer awareness of the importance of organic food can raise per capita expenditure on organic food items in the Asia-Pacific region.
Asia-Pacific Organic Fertilizer Industry Overview
The Asia-Pacific Organic Fertilizer Market is fragmented, with the top five companies occupying 6.60%. The major players in this market are Coromandel International Ltd, Genliduo Bio-tech Corporation Ltd, Gujarat Narmada Valley Fertilizers & Chemicals Ltd, Gujarat State Fertilizers & Chemicals Ltd and Swaroop Agrochemical Industries (sorted alphabetically).
Additional Benefits:
The market estimate (ME) sheet in Excel format
3 months of analyst support
TABLE OF CONTENTS
1 EXECUTIVE SUMMARY & KEY FINDINGS
2 REPORT OFFERS
3 INTRODUCTION
3.1 Study Assumptions & Market Definition
3.2 Scope of the Study
3.3 Research Methodology
4 KEY INDUSTRY TRENDS
4.1 Area Under Organic Cultivation
4.2 Per Capita Spending On Organic Products
4.3 Regulatory Framework
4.3.1 Australia
4.3.2 China
4.3.3 India
4.3.4 Indonesia
4.3.5 Japan
4.3.6 Philippines
4.3.7 Thailand
4.3.8 Vietnam
4.4 Value Chain & Distribution Channel Analysis
5 MARKET SEGMENTATION (includes market size in Value in USD and Volume, Forecasts up to 2030 and analysis of growth prospects)
5.1 Form
5.1.1 Manure
5.1.2 Meal Based Fertilizers
5.1.3 Oilcakes
5.1.4 Other Organic Fertilizers
5.2 Crop Type
5.2.1 Cash Crops
5.2.2 Horticultural Crops
5.2.3 Row Crops
5.3 Country
5.3.1 Australia
5.3.2 China
5.3.3 India
5.3.4 Indonesia
5.3.5 Japan
5.3.6 Philippines
5.3.7 Thailand
5.3.8 Vietnam
5.3.9 Rest of Asia-Pacific
6 COMPETITIVE LANDSCAPE
6.1 Key Strategic Moves
6.2 Market Share Analysis
6.3 Company Landscape
6.4 Company Profiles (includes Global Level Overview, Market Level Overview, Core Business Segments, Financials, Headcount, Key Information, Market Rank, Market Share, Products and Services, and Analysis of Recent Developments).