미국의 밴 시장 : 시장 점유율 분석, 산업 동향 및 통계, 성장 예측(2025-2030년)
United States Vans - Market Share Analysis, Industry Trends & Statistics, Growth Forecasts (2025 - 2030)
상품코드:1693614
리서치사:Mordor Intelligence
발행일:2025년 03월
페이지 정보:영문
라이선스 & 가격 (부가세 별도)
ㅁ Add-on 가능: 고객의 요청에 따라 일정한 범위 내에서 Customization이 가능합니다. 자세한 사항은 문의해 주시기 바랍니다.
ㅁ 보고서에 따라 최신 정보로 업데이트하여 보내드립니다. 배송기일은 문의해 주시기 바랍니다.
한글목차
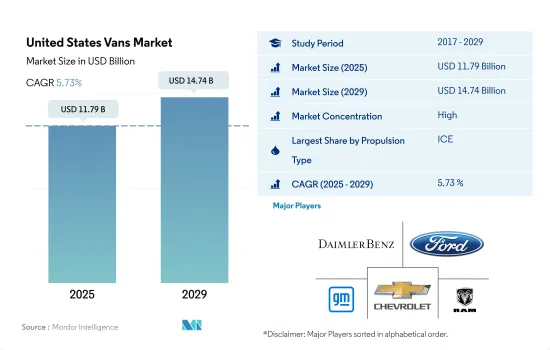
미국의 밴 시장 규모는 2025년에 117억 9,000만 달러로 추정 및 예측되고, 2029년에는 147억 4,000만 달러에 이를 것으로 예측되며, 예측 기간 중(2025-2029년)의 CAGR은 5.73%를 나타낼 것으로 예측됩니다.
미국 경상용 밴 시장은 2017년 41만 대에서 2022년 33만 대로 성장했으며, 2024년에는 34만 6,949대로 반등할 전망
2022년 미국의 경상용 밴 판매량은 33만 대로 감소하여 2021년 34만 대에서 하락세를 이어갔습니다. 지난 몇 년 동안 관찰된 이러한 감소세는 비즈니스 물류 및 도시 계획의 변화로 인해 특히 인구 밀집 지역에서 이러한 차량에 대한 수요가 감소한 것을 반영합니다. 그러나 시장은 안정화되고 있는 것으로 보입니다.
22017년 미국 경상용 밴 시장은 41만 대라는 견고한 수치를 자랑했습니다. 2019년까지 비교적 안정적인 판매량을 유지했지만 2020년부터 눈에 띄는 감소세를 보이기 시작했습니다. 초기 안정세는 운송 및 물류 수요를 밴에 크게 의존하는 부문에서 기인한 것으로 볼 수 있습니다. 그러나 이후 감소세는 도시 혼잡과 진화하는 비즈니스 모델로 인한 문제와 맞물려 더욱 작고 효율적인 운송 솔루션을 선호하게 되었습니다.
2024년 이후 미국 경상용 밴 시장은 점진적인 회복세를 보일 것으로 전망됩니다. 판매량은 약간의 변동이 있을 것으로 예상되지만 상승세를 유지하여 2030년에는 약 38만 5,500대에 이를 것으로 전망됩니다.
미국의 밴 시장 동향
정부 노력과 미국 내 수요 증가에 따른 전기자동차 판매의 급격한 성장
미국은 최근 몇 년 동안 전기자동차(EV) 도입이 크게 급증했습니다. 이러한 증가세는 전기차에 대한 인식 제고, 환경에 대한 관심 증가, 정부 규제의 시행에 기인한 것으로 볼 수 있습니다. 특히 2016년 캘리포니아에서는 탄소 배출을 억제하고 대기 질을 개선하기 위해 무공해 차량(ZEV) 프로그램을 도입했습니다.
미국 내 전기 상용차에 대한 수요도 증가하고 있습니다. 전자상거래 산업의 호황, 물류 활동의 증가, 친환경 운송을 위한 정부의 노력 등의 요인이 이러한 성장을 촉진했습니다. 중요한 움직임으로 뉴욕 주지사는 2021년 9월에 첨단 클린 트럭(ACT) 규칙에 서명했습니다. 이 규칙은 2035년까지 모든 신차의 배기가스 배출량을 제로로 만들고, 2045년까지 중대형 차량의 배기가스 배출량을 제로로 만들겠다는 목표를 설정하고 있습니다. 그 결과 미국은 2022년 전기 상용차 수요가 전년 대비 21% 급증했습니다.
리베이트, 보조금, 전략적 계획을 포함한 정부의 노력은 전국적으로 차량의 전기화를 더욱 강화하고 있습니다. 2022년 5월, 바이든 대통령은 가스 구동 차량을 전기 차량으로 전환하기 위해 30억 달러 규모의 국내 배터리 제조 촉진 계획을 발표했습니다. 이러한 추진은 특히 2024-2030년 동안 미국 내 전기 이동성을 크게 향상시켜 배터리 팩에 대한 수요를 증폭시킬 것으로 예상됩니다.
미국의 밴 산업 개요
미국 밴 시장은 상위 5개 기업이 79.21%를 점유하는 등 상당히 통합되어 있습니다. 이 시장의 주요 업체는 Daimler AG (Mercedes-Benz AG), Ford Motor Company, General Motors Company, GM Motor (Chevrolet) Ram Trucking, Inc(알파벳 순 정렬) 등입니다.
기타 혜택
엑셀 형식 시장 예측(ME) 시트
3개월의 애널리스트 지원
목차
제1장 주요 요약과 주요 조사 결과
제2장 보고서 제안
제3장 소개
조사의 전제조건과 시장 정의
조사 범위
조사 방법
제4장 주요 산업 동향
인구
1인당 GDP
차량 구매를 위한 소비자 지출(CVP)
인플레이션율
자동차 대출 금리
공유 차량 서비스
전기화의 영향
EV 충전소
배터리 팩 가격
Xev 신모델 발표
연료 가격
OEM 생산 통계
규제 프레임워크
밸류체인과 유통채널 분석
제5장 시장 세분화
추진 부문
하이브리드 자동차와 전기자동차
연료 카테고리별
BEV
HEV
ICE
연료 카테고리별
디젤
가솔린
제6장 경쟁 구도
주요 전략 동향
시장 점유율 분석
기업 상황
기업 프로파일
Daimler AG(Mercedes-Benz AG)
Fiat Chrysler Automobiles NV
Ford Motor Company
General Motors Company
GM Motor(Chevrolet)
IVECO SpA
Nissan Motor Co. Ltd.
Ram Trucking, Inc.
Volkswagen AG
Workhorse Group Inc.
제7장 CEO에 대한 주요 전략적 질문
제8장 부록
세계 개요
개요
Five Forces 분석 프레임워크
세계의 밸류체인 분석
시장 역학(DROs)
출처 및 참고문헌
도표 일람
주요 인사이트
데이터 팩
용어집
HBR
영문 목차
영문목차
The United States Vans Market size is estimated at 11.79 billion USD in 2025, and is expected to reach 14.74 billion USD by 2029, growing at a CAGR of 5.73% during the forecast period (2025-2029).
US light commercial van market grew from 410,000 units in 2017 to 330,000 in 2022, with a rebound to 346,949 units expected by 2024
In 2022, the sales of light commercial vans in the United States dipped to 330,000 units, continuing the downward trend from the 2021 figure of 340,000 units. This decline, observed over the past few years, reflects shifting dynamics in business logistics and urban planning, resulting in reduced demand for these vehicles, particularly in densely populated areas. However, the market appears to be stabilizing. Projections for 2023 indicated sales of around 332,665 units. A rebound is anticipated in 2024, with sales forecasted to reach approximately 346,949 units, signaling a potential resurgence in demand for light commercial vans.
Back in 2017, the US light commercial van market boasted a robust figure of 410,000 units. Sales remained relatively steady until 2019, but a notable decline set in from 2020. The initial stability can be attributed to sectors heavily reliant on these vans for their transportation and logistics needs. However, the subsequent drop aligns with the challenges posed by urban congestion and evolving business models, favoring more compact and efficient transport solutions.
Looking beyond 2024, the US light commercial van market is poised for a gradual recovery. Sales volumes are projected to exhibit slight fluctuations but maintain an upward trajectory, culminating in an estimated 380,500 units by 2030. Factors such as advancements in vehicle design, a growing appetite for door-to-door delivery services, and the evolution of urban infrastructure are expected to fuel this growth.
United States Vans Market Trends
Rapid growth in electric vehicle sales driven by government initiatives and increasing demand in the US
The United States has witnessed a significant surge in the adoption of electric vehicles (EVs) in recent years. This uptick can be attributed to a heightened awareness of EVs, growing environmental concerns, and the implementation of government regulations. Notably, in 2016, California introduced the Zero-Emission Vehicle (ZEV) program aimed at curbing carbon emissions and improving air quality. This initiative has not only spurred the growth of electric cars within California but has also influenced other states to adopt similar ZEV regulations. Consequently, the nation saw a remarkable 634% surge in demand for battery electric vehicles (BEVs) from 2017 to 2022.
The demand for electric commercial vehicles in the United States is also on the rise. Factors such as the booming e-commerce industry, increased logistics activities, and governmental initiatives for cleaner transportation have fueled this growth. In a significant move, the governor of New York signed the Advanced Clean Truck (ACT) Rule in September 2021. This rule sets a target for all new light-duty vehicles to be zero-emission by 2035 and the same for medium- and heavy-duty vehicles by 2045. As a result, the United States witnessed a 21% surge in demand for electric commercial vehicles in 2022 compared to the previous year.
Governmental efforts, including rebates, subsidies, and strategic plans, are further bolstering the electrification of vehicles nationwide. In May 2022, President Biden unveiled a USD 3 billion plan to expedite domestic battery manufacturing, with the aim of transitioning gas-powered vehicles to electric ones. This push is expected to significantly boost electric mobility in the country, particularly during 2024-2030, thereby amplifying the demand for battery packs.
United States Vans Industry Overview
The United States Vans Market is fairly consolidated, with the top five companies occupying 79.21%. The major players in this market are Daimler AG (Mercedes-Benz AG), Ford Motor Company, General Motors Company, GM Motor (Chevrolet) and Ram Trucking, Inc. (sorted alphabetically).
Additional Benefits:
The market estimate (ME) sheet in Excel format
3 months of analyst support
TABLE OF CONTENTS
1 EXECUTIVE SUMMARY & KEY FINDINGS
2 REPORT OFFERS
3 INTRODUCTION
3.1 Study Assumptions & Market Definition
3.2 Scope of the Study
3.3 Research Methodology
4 KEY INDUSTRY TRENDS
4.1 Population
4.2 GDP Per Capita
4.3 Consumer Spending For Vehicle Purchase (cvp)
4.4 Inflation
4.5 Interest Rate For Auto Loans
4.6 Shared Rides
4.7 Impact Of Electrification
4.8 EV Charging Station
4.9 Battery Pack Price
4.10 New Xev Models Announced
4.11 Fuel Price
4.12 Oem-wise Production Statistics
4.13 Regulatory Framework
4.14 Value Chain & Distribution Channel Analysis
5 MARKET SEGMENTATION (includes market size in Value in USD and Volume, Forecasts up to 2029 and analysis of growth prospects)