India Fertilizers - Market Share Analysis, Industry Trends & Statistics, Growth Forecasts (2025 - 2030)
상품코드:1693556
리서치사:Mordor Intelligence
발행일:2025년 03월
페이지 정보:영문
라이선스 & 가격 (부가세 별도)
ㅁ Add-on 가능: 고객의 요청에 따라 일정한 범위 내에서 Customization이 가능합니다. 자세한 사항은 문의해 주시기 바랍니다.
ㅁ 보고서에 따라 최신 정보로 업데이트하여 보내드립니다. 배송기일은 문의해 주시기 바랍니다.
한글목차
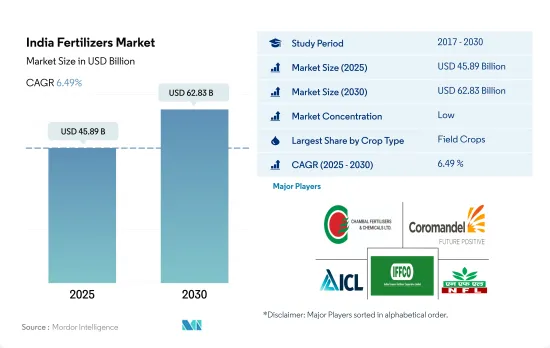
인도의 비료 시장 규모는 2025년 458억 9,000만 달러로 추정되며, 2030년에는 628억 3,000만 달러에 이를 것으로 예측되며, 예측 기간 중(2025-2030년) CAGR 6.49%로 성장할 전망입니다.
쌀은 NPK를 소비하는 주요 작물이며 국가의 비료 수요를 견인할 것으로 예상됩니다.
2022년에는 밭 작물용 비료가 시장의 89.2%를 차지했으며 2023-2030년의 CAGR은 9.8%를 나타낼 것으로 예측됩니다.
농작물의 재배면적은 2017년 1억 8,700만 헥타르에서 2022년에는 1억 9,400만 헥타르로 확대됐습니다.
2022년 원예작물용 비료는 인도 비료시장의 10.5%를 차지하며 50억 2,000만 달러로 평가되었습니다. 이러한 원예 작물의 재배 면적 증가는 수량의 최대화를 목적으로 한 비료 소비량의 병행적인 증가를 수반하고 있습니다.
인도의 잔디 및 관상 작물용 비료 분야는 극히 일부이지만, 2021년에는 7,480만 달러로 평가되었습니다.
주요 밭작물에 대한 수요 증가와 과일과 잔디 재배 면적의 확대에 의해 이 부문은 크게 성장하는 태세가 정돈되어 있습니다.
인도 비료 시장 동향
국내외 소비자 수요 증가가 인도 제작 면적 증가의 주요 원인
조사기간 중 인도에서는 농작물의 재배면적이 6% 증가했습니다.
작물별로 보면 2022년에는 쌀이 25.4%, 밀이 17.4%, 콩이 7.5%를 차지하고 인도의 농업을 지배하고 있습니다. 인도의 주식인 쌀이 큰 점유율을 차지하고 있어 재배 면적 전체의 4분의 1을 차지해, 인구의 절반 가까이를 먹이고 있습니다.
펀자브, 서 벵골, 할리야나, 라자스탄은 인도에서 주요 밀 경작지로 떠오릅니다. 2017년부터 2022년까지 인도 밀 재배는 5% 증가했습니다. 그러나 밀 생산량은 전년 1억 959만 톤에서 2022년에는 1억 774만 톤으로 감소했습니다. 이 감소는 인도 북부, 중부 및 서부의 비옥한 평원을 덮친 호우와 우박 폭풍으로 인해 발생했습니다. 이러한 자연재해는 밀을 포함한 성숙기의 겨울 심기 작물에 큰 피해를 주었고 농부에게 큰 손실을 초래했습니다.
인도 곡물 재배가 견조하고 국내외 수요가 급증하고 있기 때문에 인도 비료 시장은 2023-2030년간 성장할 전망입니다.
주요 영양소 중 질소는 농작물에서 가장 시용되는 영양소이며, 평균 시용량은 헥타르 당 223.5kg입니다.
2021년 1차 영양소의 평균 시용량은 125.1kg/ha였습니다. 특필해야할 것은 질소로, 평균 시용량은 223.5kg/ha로 가장 많았습니다. 벼와 같은 작물의 집약적인 재배를 고려하면, 중요한 영양소인 질소가 매우 중요한 역할을 하는 것은 당연합니다. 그러나 토양에서 이 영양소의 부족은 전국적으로 벼 생산성을 방해하고 있습니다.
"바이오 비료와 유기 비료의 현상" 보고서에서 강조한 것처럼 인도 토양의 건전성이 우려됩니다. 이에 따라 화학비료의 소비량이 증가하는 경향이 있으며, 검사한 토양의 97.0%, 83.0%, 71.0%가 각각 질소, 인, 칼륨의 부족을 나타내고 있습니다.
주요 작물에서는 밀, 쌀, 옥수수가 2021년의 양분 시용량 중 가장 많았고, 각각 평균 231kg/ha, 156kg/ha, 149kg/ha였습니다. 이 작물은 질소, 인, 칼륨 외에 최적의 생육을 위해 유황, 붕소, 철, 아연 등의 미량 영양소에도 의존하고 있습니다.
농작물, 특히 곡물 및 곡류는 1차 영양소, 특히 질소비료를 탐욕에 필요합니다.
인도 비료 산업 개요
인도의 비료 시장은 세분화되어 있으며 상위 5개 기업에서 27.78%를 차지하고 있습니다. 이 시장 주요 기업은 Chambal Fertilizers & Chemicals Ltd, Coromandel International Ltd., ICL Group Ltd, Indian Farmers Fertiliser Cooperative Limited, National Fertilizers Ltd입니다(알파벳순).
기타 혜택
엑셀 형식 시장 예측(ME) 시트
3개월의 애널리스트 서포트
목차
제1장 주요 요약과 주요 조사 결과
제2장 보고서 제안
제3장 소개
조사의 전제조건과 시장 정의
조사 범위
조사 방법
제4장 주요 산업 동향
주요 작물의 작부 면적
밭 작물
원예 작물
평균 양분 시용률
미량 영양소
밭 작물
원예 작물
1차 영양소
밭 작물
원예 작물
2차 다량 영양소
밭 작물
원예 작물
관개 농지
규제 프레임워크
밸류체인과 유통채널 분석
제5장 시장 세분화
유형
복합형
스트레이트
미량 영양소
붕소
구리
철
망간
몰리브덴
아연
기타
질소
우레아
기타
인산
DAP
MAP
SSP
기타
칼륨
MoP
2차 영양소
칼슘
마그네슘
유황
형태
기존
특수
CRF
액체 비료
SRF
수용성
시비 모드
시비
엽면 살포
토양
작물 유형
밭작물
원예작물
잔디 및 관상용
제6장 경쟁 구도
주요 전략 동향
시장 점유율 분석
기업 상황
기업 프로파일
Chambal Fertilizers & Chemicals Ltd
Coromandel International Ltd.
Gujarat Narmada Valley Fertilizers & Chemicals Ltd
Haifa Group
ICL Group Ltd
Indian Farmers Fertiliser Cooperative Limited
National Fertilizers Ltd
Rashtriya Chemicals & Fertilizers Ltd
Sociedad Quimica y Minera de Chile SA
Yara International ASA
제7장 CEO에 대한 주요 전략적 질문
제8장 부록
세계 개요
개요
Porter's Five Forces 분석 프레임워크
세계의 밸류체인 분석
시장 역학(DROs)
정보원과 참고문헌
도표 일람
주요 인사이트
데이터 팩
용어집
JHS
영문 목차
영문목차
The India Fertilizers Market size is estimated at 45.89 billion USD in 2025, and is expected to reach 62.83 billion USD by 2030, growing at a CAGR of 6.49% during the forecast period (2025-2030).
Rice is a major NPK-consuming crop that is expected to drive the nation's fertilizer demand
In 2022, field crop fertilizers dominated the market, accounting for 89.2%, and are projected to record a CAGR of 9.8% during 2023-2030. Rice, the leading field crop, witnessed a substantial surge in cultivation, with 47 million hectares planted in 2022, marking a 93.1% increase from 2017. Given rice's significant reliance on NPK fertilizers, it is poised to be a key driver of fertilizer demand in the country.
The area dedicated to field crops expanded from 187 million hectares in 2017 to 194 million hectares by 2022. Cereals, within the field crop category, commanded a substantial share. This surge in field crop cultivation, driven by the need to feed a growing population, is expected to propel India's fertilizer market in the coming years.
In 2022, horticultural crop fertilizers represented 10.5% of the Indian fertilizer market, valued at USD 5.02 billion. The area under horticulture cultivation witnessed a modest rise, reaching 8.9 million hectares in 2022 from 8.6 million hectares in 2017. This uptick in horticulture acreage is accompanied by a parallel rise in fertilizer consumption aimed at maximizing yields.
The turf and ornamental crop fertilizer segment in India, though a small fraction, was valued at USD 74.8 million in 2021. The government's emphasis on self-sufficiency has led to initiatives like promoting greenhouse ornamental flower production, hinting at potential growth in this segment.
With the rising demand for major field crops and the expansion of fruit and turf cultivation areas, this segment is poised for significant growth. The projected CAGR during 2023-2030 is 6.4% for field crops and 4.0% for fruits and turf.
India Fertilizers Market Trends
The rising consumer demand domestically and internationally is the major driving factor for the rising acreage in India
During the study period, the country witnessed a 6% increase in field crop cultivation. This surge in the cultivation of cereals, pulses, and oilseeds, driven by both domestic and international consumer demand, played a pivotal role in expanding the acreage.
Breaking down the crops, rice, wheat, and soybean dominated the country's agricultural landscape in 2022, accounting for 25.4%, 17.4%, and 7.5%, respectively. Rice, a staple in India, commands a significant share, covering a quarter of the total cropped area and feeding nearly half the population. It finds cultivation across the nation, with key states being West Bengal, Uttar Pradesh, Andhra Pradesh, Punjab, and Tamil Nadu. However, India's rice production dipped by 6% (104.99 million tons) in the kharif season of 2022, primarily due to reduced paddy acreage in states like Jharkhand, Madhya Pradesh, and West Bengal, grappling with rainfall deficits.
Punjab, West Bengal, Haryana, and Rajasthan emerge as the primary wheat cultivators in India. From 2017 to 2022, wheat cultivation in India witnessed a 5% increase. However, the wheat output dipped to 107.74 million tonnes in 2022 from the previous year's 109.59 million tonnes. This decline can be attributed to heavy rainfall and hailstorms that battered the fertile plains of northern, central, and western India. These natural calamities inflicted significant damage on the maturing winter-planted crops, including wheat, leading to substantial losses for farmers.
Given the robust cereal cultivation in India, bolstered by surging domestic and international demand, the Indian fertilizer market is poised for growth during 2023-2030.
Among the primary nutrients, nitrogen is the most-applied nutrient in field crops, with an average application rate of 223.5 kg per hectare
In 2021, the average application rate for primary nutrients stood at 125.1 kg/ha. Notably, nitrogen topped the list with an average application rate of 223.5 kg/ha. Given the intensive cultivation of crops like rice in the country, it is no surprise that nitrogen, being a crucial nutrient, plays a pivotal role. However, the deficiency of this nutrient in the soil is hampering rice productivity nationwide.
The soil health in India, as highlighted in the State of Biofertilizers and Organic Fertilizers report, is a cause for concern. It reveals a rising trend in the consumption of chemical fertilizers, with 97.0%, 83.0%, and 71.0% of tested soils showing deficiencies in nitrogen, phosphorous, and potassium, respectively.
Among the major crops, wheat, rice, and corn/maize led the pack in nutrient application rates in 2021, with averages of 231, 156, and 149 kg/ha, respectively. Wheat and rice, being staple foods both domestically and globally, face significant yield and profit reductions due to multiple nutrient deficiencies. Apart from nitrogen, phosphorous, and potassium, these crops also rely on micronutrients like sulfur, boron, iron, and zinc for optimal growth. Given the critical role of nutrient management in successful crop production, the market is witnessing growth.
Field crops, especially grains and cereals, have a voracious appetite for primary nutrients, particularly nitrogen fertilizers. With the extensive cultivation of these crops depleting the soil's nutrient content, the demand for fertilizers is expected to surge during 2023-2030, driving market growth.
India Fertilizers Industry Overview
The India Fertilizers Market is fragmented, with the top five companies occupying 27.78%. The major players in this market are Chambal Fertilizers & Chemicals Ltd, Coromandel International Ltd., ICL Group Ltd, Indian Farmers Fertiliser Cooperative Limited and National Fertilizers Ltd (sorted alphabetically).
Additional Benefits:
The market estimate (ME) sheet in Excel format
3 months of analyst support
TABLE OF CONTENTS
1 EXECUTIVE SUMMARY & KEY FINDINGS
2 REPORT OFFERS
3 INTRODUCTION
3.1 Study Assumptions & Market Definition
3.2 Scope of the Study
3.3 Research Methodology
4 KEY INDUSTRY TRENDS
4.1 Acreage Of Major Crop Types
4.1.1 Field Crops
4.1.2 Horticultural Crops
4.2 Average Nutrient Application Rates
4.2.1 Micronutrients
4.2.1.1 Field Crops
4.2.1.2 Horticultural Crops
4.2.2 Primary Nutrients
4.2.2.1 Field Crops
4.2.2.2 Horticultural Crops
4.2.3 Secondary Macronutrients
4.2.3.1 Field Crops
4.2.3.2 Horticultural Crops
4.3 Agricultural Land Equipped For Irrigation
4.4 Regulatory Framework
4.5 Value Chain & Distribution Channel Analysis
5 MARKET SEGMENTATION (includes market size in Value in USD and Volume, Forecasts up to 2030 and analysis of growth prospects)
5.1 Type
5.1.1 Complex
5.1.2 Straight
5.1.2.1 Micronutrients
5.1.2.1.1 Boron
5.1.2.1.2 Copper
5.1.2.1.3 Iron
5.1.2.1.4 Manganese
5.1.2.1.5 Molybdenum
5.1.2.1.6 Zinc
5.1.2.1.7 Others
5.1.2.2 Nitrogenous
5.1.2.2.1 Urea
5.1.2.2.2 Others
5.1.2.3 Phosphatic
5.1.2.3.1 DAP
5.1.2.3.2 MAP
5.1.2.3.3 SSP
5.1.2.3.4 Others
5.1.2.4 Potassic
5.1.2.4.1 MoP
5.1.2.5 Secondary Macronutrients
5.1.2.5.1 Calcium
5.1.2.5.2 Magnesium
5.1.2.5.3 Sulfur
5.2 Form
5.2.1 Conventional
5.2.2 Speciality
5.2.2.1 CRF
5.2.2.2 Liquid Fertilizer
5.2.2.3 SRF
5.2.2.4 Water Soluble
5.3 Application Mode
5.3.1 Fertigation
5.3.2 Foliar
5.3.3 Soil
5.4 Crop Type
5.4.1 Field Crops
5.4.2 Horticultural Crops
5.4.3 Turf & Ornamental
6 COMPETITIVE LANDSCAPE
6.1 Key Strategic Moves
6.2 Market Share Analysis
6.3 Company Landscape
6.4 Company Profiles
6.4.1 Chambal Fertilizers & Chemicals Ltd
6.4.2 Coromandel International Ltd.
6.4.3 Gujarat Narmada Valley Fertilizers & Chemicals Ltd
6.4.4 Haifa Group
6.4.5 ICL Group Ltd
6.4.6 Indian Farmers Fertiliser Cooperative Limited