


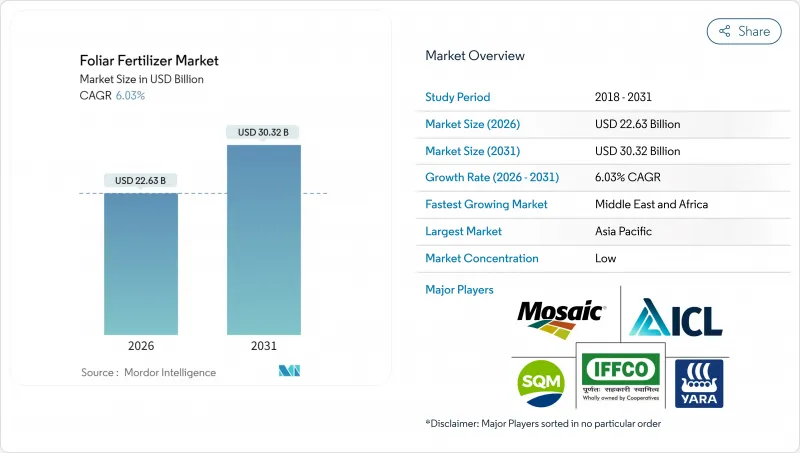
엽면 비료 시장은 2025년 213억 4,000만 달러로 평가되었고, 2026년에는 226억 3,000만 달러, 2031년까지 303억 2,000만 달러에 달할 전망입니다. 2026년부터 2031년에 걸쳐 CAGR은 6.03%를 나타낼 것으로 예상됩니다.
이 성장을 지원하는 것은 작물 영양 관리의 급속한 현대화, 정밀 농업 플랫폼의 통합 및 균형 잡힌 시비를 장려하는 정부 인센티브입니다. 아시아태평양이 주도적인 지위를 차지하고 있으며 중국과 인도의 보조금 프로그램이 보급을 가속화하고 있습니다. 한편 중동 및 아프리카은 사막농업이 수효율이 높은 영양공급으로 전환하는 가운데 가장 빠르게 성장하고 있습니다. 복잡한 다영양소 배합 비료는 단일 공정에서 해결책을 요구하는 생산자들 사이에서 지지를 모으고 있으며, 엽면 살포 프로토콜을 장려하는 탄소 크레딧 제도는 조기 도입자에게 새로운 수입원을 가져오고 있습니다. 경쟁의 치열성은 여전히 적당하며 상위 5개 공급업체가 매출의 3분의 1을 차지할 뿐이므로 제품 혁신과 지역 파트너십이 여전히 중요해지고 있습니다.
농업 보급기관은 주요 영양소공급 체제를 방해하지 않고 미량 요소 부족을 보완하는 적을 좁힌 수법으로서 엽면 시비를 추천하고 있습니다. 옥수수와 대두에 있어서의 수량 시험에서는 토양 시용의 질소 및 인산에 엽면 아연 및 망간을 보충함으로써 10-15%의 수량 향상이 확인되고 있습니다. 4R(적절한 원료원, 적절한 시용량, 적절한 시기, 적절한 장소)의 틀을 준수하는 것으로 침출이 억제되어 규제 준수를 촉진합니다. 미국의 공공 비용 분담 프로그램에서는 엽면 살포 비용의 최대 30%가 보조 대상이 되어 기술 도입의 가속을 촉진하고 있습니다. 공급업체는 판매 패키지의 일환으로 교육 서비스를 선정하여 브랜드 충성도를 높이고 반복 구매율을 높이고 있습니다.
가변율 살포기, 드론에 의한 현장 조사, IoT(사물인터넷) 텔레메트리 기술은 현장 내의 변동성에 따른 시용량 조정을 통해 엽면 비료 시장의 성능을 향상시킵니다. 데이터 기반 시용 타이밍 최적화를 통해 과다 시용을 25% 줄이고 양분 이용 효율을 향상시킵니다. 사용자는 위성식수지수와 기상예보를 통합하여 가장 침투성이 높은 잎의 성장단계를 확인하여 흡수율을 향상시키고 있습니다. 설비의 회수 기간은 현재 평균 3년이며, 이 역치는 중규모 농장 투자를 촉진하고 있습니다. 하드웨어 공급업체는 비료 제조업체와 제휴하고 소프트웨어 라이선스를 영양소 패키지와 번들로 하여 더욱 강력한 채널 파트너십을 구축하고 있습니다.
2024년 에너지 시장의 혼란으로 인해 질산암모늄 가격이 45% 상승하여 고순도 원료에 의존하는 액체엽면 살포제 제조업체의 이익률이 압박되었습니다. 선물 계약에서 일부 위험은 완화되지만 소규모 제조업체는 위험 회피를위한 신용 프레임이 부족합니다. 스팟 조달을 강요하기 때문에 많은 기업이 번성기에 생산을 제한하지 않을 수 없어 공급이 흐트러지고 있습니다. 대규모 기업이 규모의 경제를 추구하는 조달을 진행하는 동안 업계 재편이 가속될 수 있습니다. 중국에서 인산염 수출에 대한 규제 검토는 장기 계획에 추가 불확실성을 추가합니다.
2025년 시점의 엽면 비료 시장 점유율에서 단일 성분 제품은 50.18%를 차지했습니다. 이는 단일 영양소에 초점을 맞춘 제품이 저렴한 비용으로 유연한 용량을 제공하기 때문입니다. 그러나 복합 배합 제품은 CAGR 6.19%를 나타내고 있으며, 다영양소의 편리성을 요구하는 생산자로부터의 강한 수요를 알 수 있습니다. 복합 나노킬레이트화 제형은 영양소의 체류 시간을 연장시켜 비킬레이트화 염에 비해 흡수율을 20% 향상시킵니다. 생물 자극제와의 탱크 혼합 호환성을 통해 영양 보급과 스트레스 완화를 한 번의 살포로 끝낼 수 있기 때문에 노동력을 줄일 수 있습니다. 한편, 단체철 및 아연 스프레이는 감귤류의 황화병 대책 등 급성 보정에 필수적이며, 단체 제품과 복합 제품은 배타적이지 않고 보완적인 관계에 있음을 나타내고 있습니다. 복합제품의 규제신청에는 보다 많은 잔류 데이터가 요구되기 때문에 자본력이 낮은 신규 참가기업에는 장벽이 되고 있습니다.
이 기세에 대응하기 위해, 유럽과 이스라엘에서는 킬레이트화 플랜트의 고도화가 진행되고 있습니다. 마케팅 전략은 “작물에 필요한 영양소를 망라한 공급”을 축으로 전개되어, 온실 재배의 주요 지역에서는 정기 공급 계약의 보급이 진행되고 있습니다. 단일 결핍증의 개선으로 충분한 광대한 곡물밭에서는 특히 아르헨티나와 카자흐스탄에서 단품 제품이 여전히 수요를 유지하고 있습니다. 한편, 상품화된 염류 제품은 원재료 비용의 상승에 직면하면서도 가격 결정력이 수반되지 않기 때문에 할인 압력이 높아지고 있습니다.
본 엽면 비료 시장 보고서는 유형별(복합 비료와 단일 비료), 작물 유형별(노지 작물, 원예 작물, 잔디·관상 식물), 지역별(북미, 남미, 유럽, 아시아태평양, 중동 및 아프리카)로 분류되고 있습니다. 시장 예측은 금액(달러)과 수량(메트릭톤)으로 제공됩니다.
2025년 아시아태평양은 세계 수익의 43.78%를 차지했습니다. 이는 중국 정부의 리베이트 프로그램이 엽면 비료 구입 비용의 20%를 커버했기 때문입니다. 인도 농민 비료 협동조합(IFFCO)과 같은 인도 협동조합은 2025년 나노우레아 스프레이를 300만 리터로 확대하여 농민들의 인지도를 높였습니다. 열대 기후의 변동성도 분할 시용을 선호하기 때문에 몬순에 의한 침출시에는 엽면 시비가 토양의 양분 공급을 보충합니다. 베트남의 태양광 발전에 의한 냉장 창고 등 유통의 진보로 온도에 민감한 용액의 부패가 감소하고 있습니다. 주립대학과의 조사 제휴에 의해 제품의 현지화가 진행되고, 전자상거래 채널이 소규모 농가 클러스터에 도착하고 있습니다. 북미는 성숙하지만 혁신 주도 분야입니다. 정밀 농업 연결성과 탄소 오프셋 지불은 다층적 인센티브를 창출합니다. 아이오와 주 조종사 프로젝트는 엽면 유황과 가변율 질소를 병용하여 합성 비료 사용량을 12% 줄여 옥수수 생산자의 지속가능성 지표 달성을 지원하고 있습니다.
캐나다의 청정 연료 규제에서는 배출 감축 실천을 실시하는 생산자에게 크레딧이 부여되고, 잎면 살포법도 규제 준수에 산입됩니다. 시장 점유율 싸움은 권고 서비스가 열쇠가 되고, 원격 센싱 분석과 제품 공급을 조합한 기업은 자재 공급만의 벤더에 비해 계약 갱신률이 2배가 되고 있습니다. 유럽에서는 성장과 규제 제약이 균형을 이룹니다. 유럽연합의 '농장에서 식탁까지' 전략은 2030년까지 비료 사용량을 20% 삭감할 것을 의무화하여 토양 유출을 대폭 삭감하는 고효율 엽면 기술에 자금을 유도하고 있습니다. 네덜란드 원예업계는 질산마그네슘 잎면 살포 드립미스트 시스템을 선구적으로 도입하여 온실 오이의 수율을 15% 향상시키면서 유출량을 저수준으로 유지하고 있습니다. 폴란드와 루마니아가 농업기계를 현대화하는 가운데 동유럽은 생산량 확대의 견인역으로 대두하고 있습니다. 미량영양소 잔류기준이 엄격화되어 유럽식품안전기관의 제한치에 적합하기 위한 재배합이 요구되고 있습니다. 신속하게 인증을 받은 공급업체는 선행자 우위를 통해 시장 진입 기회를 얻을 수 있습니다.
중동 및 아프리카은 CAGR 6.42%로 가장 급속히 성장할 전망입니다. 사우디아라비아의 「비전 2030」은 사막의 수자원 보전을 위해 엽면 살포 자재를 많이 사용하는 수경 재배 메가 팜에 자금을 투입합니다. 케냐의 아보카도 수출업체는 저농도의 동엽면 혼합제로 유럽의 엄격한 잔류기준을 충족하여 수출수입률을 향상시킵니다. 인프라 부족은 남는 것, 이동식 콜드체인 유닛이 도시 주변부에 도달해, 폐기물 감축에 공헌합니다. 남아프리카의 곡물 부문에서는 급등하는 요소 가격을 보충하기 위해 드론에 의한 엽면 질소 살포를 시험 도입하여 8%의 수율 증가를 확인하고 있습니다.
The foliar fertilizer market is expected to grow from USD 21.34 billion in 2025 to USD 22.63 billion in 2026 and is forecast to reach USD 30.32 billion by 2031 at 6.03% CAGR over 2026-2031.
Rapid modernization of crop nutrition, integration of precision-ag platforms, and government incentives that reward balanced fertilization underpin this growth. Asia-Pacific dominates because subsidy programs in China and India accelerate adoption. At the same time, the Middle East and Africa are the fastest-growing regions as desert farming pivots toward water-efficient nutrient delivery. Complex, multi-nutrient blends gain traction as growers look for single-pass solutions, and carbon-credit schemes that reward foliar protocols create new income streams for early adopters. Competitive intensity remains moderate; the top five suppliers command only one-third of sales, so product innovation and regional partnerships remain pivotal.
Extension agencies endorse foliar feeding as a targeted method to correct micronutrient shortages without disturbing macronutrient regimes. Yield trials in corn and soybeans show 10-15% gains when foliar zinc and manganese supplement soil-applied nitrogen and phosphorus. Adherence to the 4R (Right Source, Right Rate, Right Time, Right Place) framework reduces leaching, supporting regulatory compliance. Public cost-share programs in the United States reimburse up to 30% of foliar application expenses, motivating faster technology turnover. Suppliers position educational services as part of the sales package, strengthening brand loyalty and raising repeat-purchase rates.
Variable-rate sprayers, drone scouting, and IoT (Internet of Things) telemetry elevate foliar fertilizer market performance by matching dosage to in-field variability. Data-driven timing cuts over-application by 25% and improves nutrient-use efficiency. Users integrate satellite vegetation indices with weather forecasts to pinpoint the most permeable leaf stages, boosting uptake. Equipment payback periods now average three years, a threshold that persuades medium-sized farms to invest. Hardware vendors partner with fertilizer producers to bundle software licenses with nutrient packages, weaving stronger channel partnerships.
Ammonium nitrate prices climbed 45% in 2024 due to energy-market turmoil, squeezing margins for liquid foliar producers that rely on high-purity inputs. Forward contracts mitigate some risk, yet small manufacturers lack the credit lines to hedge. Spot sourcing forces many to ration production in peak season, disrupting supply. Industry consolidation could accelerate as bigger firms pursue economy-of-scale procurement. Regulatory reviews of phosphate exports from China inject further uncertainty into long-term planning.
Other drivers and restraints analyzed in the detailed report include:
For complete list of drivers and restraints, kindly check the Table Of Contents.
Straight products account for 50.18% of the foliar fertilizer market share in 2025 because their single-nutrient focus offers low cost and flexible dosing. Yet complex blends show a 6.19% CAGR, indicating a stronger pull from growers who want multi-nutrient convenience. Complex nanochelated formulas extend nutrient residence time, lifting uptake by 20% compared with unchelated salts. Their tank-mix compatibility with biostimulants trims labor because one pass suffices for both nutrition and stress mitigation. Straight iron or zinc sprays remain vital for acute corrections, such as citrus greening defense, underscoring a complementary rather than exclusive relationship. Regulatory dossiers for complex products demand more residue data, creating barriers that deter low-cap ex entrants.
Suppliers upscale chelation plants in Europe and Israel to match this momentum. Marketing positions revolve around "complete crop diets," and subscription supply contracts gain traction in greenhouse hubs. Straight products keep traction in broad-acre cereals where single-deficiency fixes suffice, especially in Argentina and Kazakhstan. Discounting pressure intensifies because commoditized salts face rising raw-material costs without parallel pricing power.
The Foliar Fertilizer Market Report is Segmented by Type (Complex and Straight), Crop Type (Field Crops, Horticultural Crops, and Turf and Ornamental), and Geography (North America, South America, Europe, Asia-Pacific, The Middle East, and Africa). The Market Forecasts are Provided in Terms of Value (USD) and Volume (Metric Tons).
Asia-Pacific contributed 43.78% of global revenue in 2025, as government rebate programs in China covered up to 20% of foliar purchase costs. Indian cooperatives such as Indian Farmers Fertiliser Cooperative Limited (IFFCO) scaled nano-urea sprays to 3 million liters in 2025, widening farmer familiarity. Tropical climatic variability also favors split applications, so foliar feeding supplements soil regimes during monsoon leaching events. Distribution advances, including solar-powered cold stores in Vietnam, reduce spoilage for temperature-sensitive solutions. Research partnerships with state universities sharpen product localization, and e-commerce channels reach smallholder clusters. North America offers a mature but innovation-driven arena. Precision-ag connectivity and carbon-offset payments create layered incentives. Pilot projects in Iowa report that foliar sulfur combined with variable-rate nitrogen cuts total synthetic use by 12%, helping maize growers meet sustainability metrics.
Canada's Clean Fuel Regulations credit growers for emission-reducing practices, and foliar methods count toward compliance. Market-share battles hinge on advisory services; companies that bundle remote sensing analytics with product supply win renewals at double the rate of input-only vendors. Europe balances growth with regulatory constraint. The European Union Farm to Fork strategy mandates a 20% fertilizer reduction by 2030, steering funds toward high-efficiency foliar technologies that slash soil losses. Dutch horticulture pioneers foliar magnesium nitrate drip-mist systems that lift greenhouse cucumber yields 15% while maintaining low runoff. Eastern Europe emerges as a volume booster as Poland and Romania upgrade machinery fleets. Micronutrient residue thresholds tighten, forcing reformulation to comply with European Food Safety Authority limits. Suppliers that certify quickly enjoy first-mover shelf access.
The Middle East and Africa grows fastest at 6.42% CAGR. Saudi Vision 2030 funds hydroponic megafarms that lean heavily on foliar inputs to conserve desert water. Kenyan avocado exporters meet strict European residue caps using low-rate copper foliar mixes, boosting export acceptance rates. Infrastructure gaps persist, but mobile cold-chain units now reach peri-urban hubs, reducing spoilage. South Africa's grain sector trials drone-based foliar nitrogen to offset high urea prices, showing 8% yield uplift.