

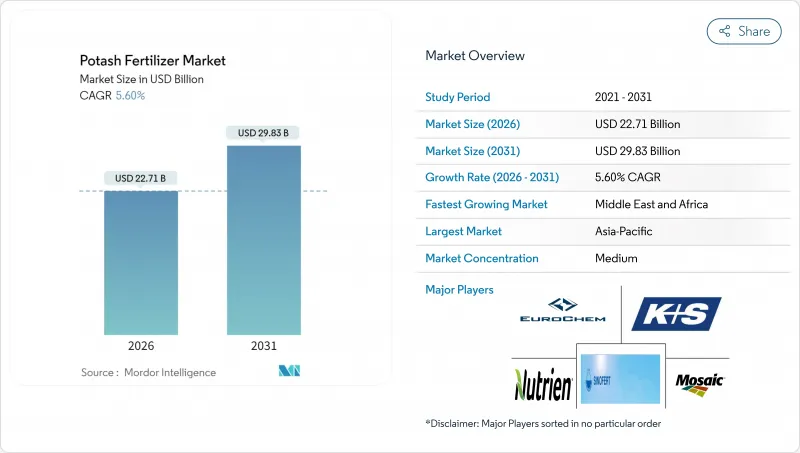
2026년 칼륨비료 시장 규모는 227억 1,000만 달러로 추정되며, 2025년 215억 1,000만 달러에서 성장한 수치입니다. 2031년에는 298억 3,000만 달러에 이르고, 2026년부터 2031년까지 CAGR은 5.6%를 나타낼 것으로 예상됩니다.
장기적인 수요의 견고함은 집약농업지역에서의 토양분갈 가속, 정밀시비툴의 급속한 보급, 국내 곡물생산을 촉진하는 중국에서 사료배합의 정책 주도형 전환에 기인하고 있습니다. 생산자 측에서는 걸프 국가에서 특수 작물의 제작 면적 확대, 그린 수소용 염동 저장 시설로부터의 새로운 산업 수요, 그리고 민감한 토양용으로 저염화물 황산칼륨을 추천하는 기업의 넷 제로 목표 달성에의 대처도 추풍이 되고 있습니다. 브라질의 물류 병목 현상과 에너지 가격 변동이 비용 압력이 되는 반면, 주요 공급업체는 생산 능력을 확대하고, 통합된 유통망, 농약의 의사결정 주기에 더 깊은 통합을 가능하게 하는 디지털 농업 서비스를 통해 대응하고 있습니다. 이러한 요인들이 결합되어 2030년까지 칼륨비료 시장의 지속적인 성장이 시사되고 있습니다.
수십년에 걸친 고수량 옥수수 및 대두륜작과 이모작 시스템에 의해 칼륨 저장량이 자연 풍화에 의한 보충 속도를 웃도는 페이스로 고갈해, 많은 표토가 기능적으로 부족 상태에 빠지고 있습니다. 미국 중서부에서는 현재 농지의 대부분(60%)이 농학적 필요 기준치를 밑돌고 있으며, 이 비율은 2021년 이후 기록적인 비료 지출에도 불구하고 매 시즌 증가를 계속하고 있습니다. 비슷한 토양 열화가 중국의 장강곡창지대에서도 진행 중입니다. 여기에서는 벼농사와 밀작의 집약적인 윤작체계가 휴경기간을 단축하여 유기물의 회복을 막고 있습니다. 새롭게 개간된 브라질의 셀라드 지역은 당초 비옥으로 보이지만, 5작기도 지나지 않아 토양 중의 천연 광물이 산화 및 용출하기 때문에 대량의 칼륨비료가 필요합니다. 이러한 겹치는 패턴이 구조적인 소비 기반을 형성해, 칼륨비료 시장을 제작 면적의 주기적인 변동으로부터 지키고 있습니다. 농학자는 이 영양소 부족을 해소할 수 없으면 10년 이내에 세계의 곡물 수율이 6-8% 감소할 가능성이 있다고 경고하고 있어 지속적인 칼륨비료 시용의 긴급성을 더욱 강화하고 있습니다.
가변 살포율 스프레더, 멀티스펙트럼 드론, 현장내 칼륨 프로브를 통해 농가가 기존의 일률 살포에서는 놓친 미소결핍 영역을 확인할 수 있게 되었습니다. 존디어의 데이터에 따르면 2,000에이커 이상의 농장에서는 존별 처방으로 전환한 후 잠재적인 저칼륨대가 수정된 결과 총 칼륨 사용량이 15% 증가하고 있습니다. 디지털 플랫폼은 시비 작업의 시간 기록도 수행하기 때문에 칼륨이 식물 흡수 피크의 며칠 전이 아닌 몇 시간 전에 투입되어 곡물의 무게와 농가의 수익을 향상시킵니다. 장비 제조업체는 센서와 소프트웨어를 대출 패키지에 통합하여 초기 도입 장벽을 줄임으로써 옥수수 벨트와 캐나다 대평원 지역에서의 보급을 가속화하고 있습니다. 유럽의 공통 농업 정책(CAP)은 디지털 매핑 비용의 상환으로 추진력을 더해 2025년까지 독일과 프랑스의 대규모 농장의 40%에서 정밀 농업의 도입을 촉진합니다. 이러한 도구가 중형 농장에 널리 보급됨에 따라 칼륨비료 시장은 지속적인 수요 증가를 얻고 효율화의 점진적인 향상을 상쇄합니다.
2024년 3월에 발효한 유럽연합(EU)의 규제에 의해 벨로루시의 칼리 생산능력 약 1,200만톤(세계거래량의 5분의 1에 상당)이 정지되었습니다. 대체화물 확보에 분주한 트레이더로 스팟 가격은 몇 주간 30% 급등. 동남아시아를 위한 해상 운송 기간은 공급망의 재편에 따라 2개월 연장되었습니다. 인도와 중국의 수입업체들은 러시아와 캐나다 광산업자들에게 눈을 돌렸지만, 철도와 항만의 혼잡으로 대체 공급량은 두드러졌습니다. 은행은 벨로루시 관련 신용장 거래에 대한 경계감을 강화하고 대출 프리미엄이 탑재되어 농업 투입 비용으로 전가됩니다. 제재 대상분 중 일부는 제3국 경유로 유입될 가능성도 있지만, 불확실성 때문에 사용자는 선물 예약에 신중한 자세를 유지하고 있습니다. 이 제약은 적어도 2026년까지 지속되어 칼륨비료 시장의 잠재적인 상승 여지를 억제할 전망입니다.
2025년 염화칼륨은 칼륨비료 시장 점유율의 86.05%를 차지했으며 대규모 곡물 생산 시스템에서 저비용 영양 기반으로서의 역할을 반영하고 있습니다. 그 보급은 일반적인 살포기와의 호환성과 농업지대를 빠르게 횡단하는 대량 수송을 가능하게 하는 철도망에 기인합니다. 박리로 운영하는 옥수수, 콩, 밀 생산자에게 칼륨 단가는 여전히 결정적인 요소입니다. 그 결과, 염화칼륨은 가격이 상승 경향에 있어도 조달 계획의 기반으로 자리매김하고 있습니다.
황산 칼륨은 제어 환경 하에서 농업과 염화물에 민감한 작물의 보급에 따라 5.85%라는 높은 CAGR로 확대되고 있습니다. 온실 토마토, 식용 포도, 감자 생산자는 제품 품질과 수출 프리미엄을 지원하는 황산 칼륨의 저염화물 특성을 높이 평가합니다. 유럽이 도입을 이끌고 있으며 독일과 네덜란드에서는 가열식 유리 온실에서 널리 사용됩니다. 북미의 과일·야채 생산자도 이에 계속되고 있습니다.
본 칼륨비료 시장 보고서는 제품별(염화칼륨, 황산칼륨, 기타), 시용 방법별(페르티게이션, 엽면 살포, 토양 시용), 작물 종별(노지 작물, 원예 작물, 잔디·관상 식물), 지역별(북미, 남미, 유럽, 아시아태평양, 중동 및 아프리카)로 분류되고 있습니다. 시장 예측은 금액과 수량 기준으로 제공됩니다.
아시아태평양은 2025년 세계 칼륨비료 시장 점유율의 41.90%를 차지했으며, 가장 규모가 큰 지역 점유율이 되었습니다. 이 지역은 고밀도 곡물지대에서 확대되는 다년생 식물재배에 이르는 다양한 농업시스템에 의해 2031년까지 연평균 복합 성장률(CAGR)은 5.5%를 보일 것으로 예측됩니다. 정밀 농업 자재와 균형 잡힌 영양 보급을 보조하는 정책 인센티브로 인해 가격 상승에도 불구하고 적용률이 증가하는 경향이 있습니다. 환경 제어형 농업에 대한 투자는 광범위한 면적에서 생산되는 염화칼륨을 보완하는 저염화물 등급 비료에 대해 일년 내내 안정적인 수요를 창출하고 있습니다. 자원이 풍부한 경제권의 광업서비스 기업도 비료유통사업에 진출하여 원격지 생산지역에서공급안정성 향상에 공헌하고 있습니다.
북미, 중동, 아프리카에서는 2026년부터 2031년까지 연평균 복합 성장률(CAGR) 6.82%라는 가장 빠른 확대 속도가 예상됩니다. 북미에서는 가변 시비 기술의 보급에 의해 숨겨진 칼륨 부족이 밝혀지고 있으며, 1에이커당 효율이 향상되는 한편, 총양분 사용량은 증가 경향에 있습니다. 동시에 중동 및 아프리카의 건조·반건조 지역에서는 관개 설비의 확충과 식량 안보 프로그램에 의해 종래에는 한계 농지로 되어 있던 토지가 활용되기 시작하고 있습니다. 사막 지대의 온실 전용 특수 황산염 비료의 출하는 신규 작부지용 염화칼륨의 대량 유통을 보완하여 지역의 제품 구성의 균형을 유지하고 있습니다.
유럽과 남미에서는 영양 관리와 수출 경쟁력이 조화되면 성숙한 경작지가 여전히 수요를 견인할 수 있음을 보여줍니다. 동유럽 생산자들은 토양 회복을 위해 존 샘플링을 도입하는 반면 서유럽 시장에서는 유기 인증 요건을 충족하는 고품질 황산염 혼합 비료가 선호되고 있습니다. 남미의 칼륨비료 시장은 물류 병목 현상과 통화 변동에도 불구하고 현저한 CAGR로 확대될 것으로 예측됩니다. 철도와 항만의 지속적인 개선과 더불어 디지털 농학 툴의 보급이 진행됨에 따라 공급 제약이 완화되고 이 지역의 성장세가 지속될 것으로 예측됩니다.
potash fertilizer market size in 2026 is estimated at USD 22.71 billion, growing from 2025 value of USD 21.51 billion with 2031 projections showing USD 29.83 billion, growing at 5.6% CAGR over 2026-2031.

Strong long-term demand arises from accelerating soil-nutrient depletion across intensively farmed regions, rapid adoption of precision-application tools, and policy-driven shifts in Chinese livestock feed formulations that boost domestic grain output. Producers are also benefiting from rising specialty crop acreage in Gulf states, an emerging industrial pull from green-hydrogen salt caverns, and corporate net-zero commitments that favor low-chloride sulfate of potash for sensitive soils. While logistics bottlenecks in Brazil and energy-price swings add cost pressure, leading suppliers are countering through capacity expansions, integrated distribution, and digital agronomy services that embed the product more deeply into farm decision cycles. Together, these forces point to continued momentum for the potash fertilizer market through 2030.
Decades of high-yield corn-soybean rotations and double-cropping systems have stripped potassium reserves faster than natural weathering can replace them, leaving many topsoils functionally deficient . In the U.S. Midwest, 60% of fields now test below agronomic sufficiency thresholds, a share that has risen every season since 2021 despite record fertilizer outlays. Similar erosion is unfolding in China's Yangtze grain belt, where intensive rice-wheat schedules compress fallow windows and prevent organic matter recovery. Newly cultivated Brazilian cerrado land appears fertile at first, yet within five growing cycles, it requires heavy potash doses as native minerals are oxidized and leached. These overlapping patterns create a structural consumption floor that insulates the potash fertilizer market from cyclical acreage swings. Agronomists warn that failing to close the nutrient gap could slice global cereal yields by 6-8% within a decade, reinforcing the urgency of sustained potassium application.
Variable-rate spreaders, multispectral drones, and in-field potassium probes now let growers pinpoint micro-zones of deficiency that blanket applications once missed. John Deere data show farms above 2,000 acres raise total potash use by 15% after switching to zone-specific prescriptions because hidden low-K strips are finally corrected. Digital platforms also timestamp each pass, ensuring potassium is placed hours rather than days before peak plant uptake, which boosts grain weight and farmer revenue. Equipment makers bundle sensors and software into financing packages, lowering upfront barriers and speeding adoption in the Corn Belt and Canadian Prairies. Europe's Common Agricultural Policy adds fuel by reimbursing digital mapping costs, pushing precision adoption toward 40% of large holdings in Germany and France in 2025. As these tools migrate to medium-sized farms, the potash fertilizer market gains a durable volume lift that offsets incremental efficiency gains.
European Union restrictions that took effect in March 2024 sidelined nearly 12 million tons of Belarusian potash capacity, equal to one fifth of global traded volume. Spot prices spiked 30% within weeks as traders scrambled for replacement cargoes, and ocean freight times to Southeast Asia lengthened by two months while supply chains realigned. Importers in India and China turned to Russian and Canadian miners, yet rail and port congestion capped replacement flows. Banks grew wary of letters of credit tied to Belarus, adding financing premiums that filter down to farm input costs. Though some sanctioned volumes may leak through third-country channels, uncertainty keeps users cautious about forward bookings. This constraint will persist at least through 2026, dampening potential upside for the potash fertilizer market.
Other drivers and restraints analyzed in the detailed report include:
For complete list of drivers and restraints, kindly check the Table Of Contents.
Muriate of Potash held 86.05% of the potash fertilizer market share in 2025, reflecting its role as the low-cost nutrient foundation for large grain systems. Its popularity stems from compatibility with common spreaders and rail networks that move bulk volumes quickly across farm belts. Cost per unit of potassium remains the deciding factor for corn, soybean, and wheat growers who manage thin operating margins. As a result, muriate continues to anchor procurement plans even when prices cycle upward.
Sulfate of Potash is expanding at a faster 5.85% CAGR as controlled-environment farms and chloride-sensitive crops gain ground. Growers of greenhouse tomatoes, table grapes, and potatoes value sulfate's low chloride profile, which supports product quality and export premiums. Europe leads adoption, with Germany and the Netherlands using it widely in heated glasshouses, while North America fruit and vegetable producers follow closely.
The Potash Fertilizer Market Report is Segmented by Product (Muriate of Potash, Sulfate of Potash, and Others), Application Mode (Fertigation, Foliar, and Soil), Crop Type (Field Crops, Horticultural Crops, and Turf and Ornamental), and Geography (North America, South America, Europe, Asia-Pacific, Middle East, and Africa). The Market Forecasts are Provided in Terms of Value and Volume.
The Asia-Pacific region captured 41.90% of the global potash fertilizer market share in 2025, representing the largest regional share. The region is projected to advance through 2031 at 5.5% CAGR, as diversified farming systems range from high-intensity grain belts to expanding perennial plantations. Policy incentives that subsidize precision inputs and balanced nutrition are increasing application rates, even as prices rise. Investments in controlled-environment agriculture add steady, year-round demand for low-chloride grades that complement broad-acre muriate volumes. Mining service firms in resource-rich economies are also pivoting into fertilizer distribution, improving supply security across remote production zones.
North America, the Middle East, and Africa are expected to experience the fastest expansion pace at a 6.82% CAGR between 2026 and 2031. In North America, widespread variable-rate technology is revealing hidden potassium deficits that push total nutrient use upward even as per-acre efficiency climbs. Concurrently, irrigation build-outs and food security programs across arid and semi-arid regions in the Middle East and Africa are unlocking previously marginal cropland. Specialty sulfate shipments into desert greenhouses complement bulk muriate flows into new row-crop estates, balancing the regional product mix.
Europe and South America demonstrate how mature acreage can still drive demand when nutrient stewardship and export competitiveness are aligned. Eastern European growers are rebuilding depleted soils and adopting zone sampling, while Western markets favor premium sulfate blends that mesh with organic labeling requirements. South America's potash fertilizer market is projected to grow at a significant CAGR, despite logistics bottlenecks and currency fluctuations. Ongoing rail and port upgrades, combined with the wider adoption of digital agronomy tools, are expected to alleviate supply constraints and sustain the region's growth momentum.