ㅁ Add-on 가능: 고객의 요청에 따라 일정한 범위 내에서 Customization이 가능합니다. 자세한 사항은 문의해 주시기 바랍니다.
ㅁ 보고서에 따라 최신 정보로 업데이트하여 보내드립니다. 배송기일은 문의해 주시기 바랍니다.
한글목차
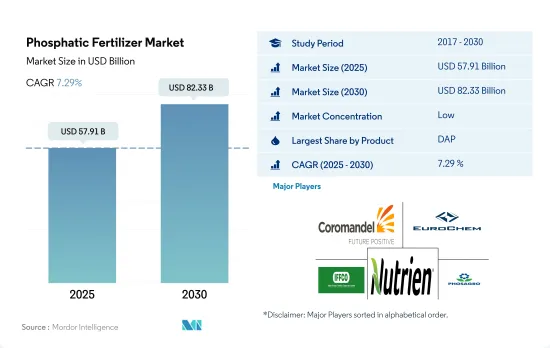
인산 비료 시장 규모는 2025년에 579억 1,000만 달러로 추정되고, 2030년에는 823억 3,000만 달러에 이를 것으로 예측되며, 예측 기간(2025-2030년) 중 CAGR 7.29%로 성장할 전망입니다.
토양의 인 함량 감소와 작물 성장에서 인 원소의 필요성이 시장을 견인할 가능성
인산이암모늄(DAP)은 2022년 인산 비료 시장을 석권했으며 3,090만 톤에 상당하는 41.3%의 세계 소비 점유율을 획득했습니다. DAP의 인기는 인산 46.0%, 암모늄 18.0%라는 조성이 질소원으로서 기능하는 것에 기인하고 있습니다. 이 때문에 DAP는 전 세계 농가에게 가장 좋은 선택지가 되고 있습니다. DAP의 시장 가치는 2022년에 233억 달러에 달했습니다.
인산1암모늄(MAP)은 DAP에 이어 두 번째로 선호되는 인산 비료로 부상했습니다. MAP의 세계 시장은 2022년 113억 달러로 평가되었으며, 소비량은 1,530만 톤에 달했습니다. 특기할 만한 것은 MAP의 수용성 인산함량이 약 90%로 작물의 생육요건을 상회하고 있다는 점입니다.
트리플과인산염(TSP)은 인산 함유율이 46.0%로 가장 높은 순수한 인산염 기반 비료로 2022년 세계 인산비료 소비량의 21.1%를 차지했습니다. TSP 시장은, 특히 콩과 작물의 재배 면적의 확대와 함께 성장할 전망입니다.
단일 과인산염(SSP)은 2022년 세계의 인산 비료 소비량의 16.7%를 차지했습니다. SSP는 식용유에 중요한 유황 미량 요소와 산성 토양에서의 칼슘 영양소를 공급하는 역할을 하기 때문에, 유량 작물에서 중요한 용도를 찾아내고 있습니다. 이러한 요인은 향후 몇 년간 SSP 사용량이 증가할 가능성을 보여줍니다.
인산 비료 시장은 견조한 성장이 예상되며 2023-2030년 CAGR 7.0%로 추정됩니다. 이 성장의 주된 원인은 작물 수확량의 향상을 목표로 하는 농가가 증가함에 따라 인산 비료의 수요가 세계적으로 높아지고 있다는 것입니다.
생산성을 향상시킬 필요성과 인산 결핍에 대처하는 수요 증가가 시장 성장을 가속할 것으로 예상됩니다.
아시아태평양은 세계의 인산 비료 시장을 독점하고, 시장 전체의 약 58.6%를 차지해, 2022년에는 약 328억 달러를 계상했습니다. 2022년 DAP는 아시아 태평양 인산비료 시장에서 49.8%의 시장 점유율을 차지했습니다. 이 지역에서 DAP 수요가 큰 것은 TSP나 SSP 같은 다른 인산 비료보다 효율이 높기 때문입니다.
중국은 세계 유수의 인산 비료의 생산국으로, 2022년 세계의 인산 비료 시장에서 금액 점유율은 약 10.3%였습니다. 그 수출은 세계 수출의 약 25.3%를 차지하고 있습니다. 중국으로부터의 수입 상위국은 인도네시아, 호주, 이란입니다.
북미는 10.6%로 2위 시장 점유율을 확보했습니다. 인산 비료는 질소 비료에 이어 작물에 있어서 중요한 영양원입니다. 북미에서는 인산일암모늄(MAP)이 66.3%, 인산이암모늄(DAP)이 30.9%의 점유율을 차지했습니다. MAP는 인산염 함량이 높아 수요를 견인했습니다.
2022년 남미의 인산 비료 시장은 세계 시장의 20.3% 점유율을 차지했으며, 2023-2030년 CAGR은 6.9%로 예측됩니다.
세계의 인산 비료 시장은 주로 COVID-19의 대유행에 의한 혼란에 기인하는 2020년의 침체를 제외하면 금액 및 수량 모두 일관된 상승 궤도를 따라가고 있습니다. 그러나 2023-2030년 세계 경작 면적 감소로 시장 규모가 회복될 것으로 예상됩니다.
세계의 인산 비료 시장 동향
증가하는 식량 수요를 충족시키기 위한 농업에 대한 압력 증가로 농작물 재배 면적이 증가할 것으로 예상됩니다.
세계의 농업 부문은 많은 과제에 종사하고 있습니다. 유엔은 2050년까지 세계 인구가 90억 명을 돌파할 것으로 예측하고 있으며, 이미 노동력 부족과 도시화로 인한 경작지 축소에 시달리고 있는 농업에 부담을 줄 수 있습니다. 유엔식량농업기관은 2050년까지 세계 인구의 70%가 도시에 거주하게 될 것으로 예측했습니다. 전 세계적으로 경지가 감소하는 가운데, 농가는 식량 수요의 증가에 대응하기 위해 작물의 수확량을 늘리는 비료에 대한 의존을 강화하고 있습니다.
아시아태평양은 세계 유수의 농업 생산지이며, 그 노동력의 약 20%를 농업이 차지하고 있습니다. 농작물이 주류를 이루며, 이 지역 작부 면적의 95% 이상을 차지하고 있습니다. 쌀, 밀, 옥수수는 2022년 작부 면적의 24.3%를 차지하며 이 지역의 주요 농작물입니다.
북미는 세계 제2위의 경작 가능 지역이며, 농작물을 중심으로 한 다양한 작물 포트폴리오를 자랑하고 있습니다. 특히, 옥수수, 면화, 쌀, 대두, 밀이 중심이 되고 있는 것은 미국 농무성이 강조하고 있는 대로입니다. 2022년 미국은 북미 작물 재배 면적의 46.2%를 차지했습니다. 그러나 텍사스와 휴스턴과 같은 지역에서의 대홍수를 포함한 악환경이 2017-2019년 이 나라의 작물 재배 면적을 대폭 감소시켜 기후변화에 대한 농업생산의 취약성을 부각시켰습니다.
캐놀라는 칼륨 비료의 시용량이 세계적으로 가장 많고 평균 시용량은 248.6kg/ha입니다.
옥수수, 유채, 면화, 설탕, 쌀, 밀, 콩은 양분 요구량이 높은 것으로 알려진 세계적으로 유명한 작물입니다. 2022년 이들 작물의 평균 1차 양분 시용량은 옥수수(230.57kg/ha), 유채(255.75kg/ha), 목화(172.70kg/ha), 수수(158.46kg/ha), 쌀(154.49kg/ha), 밀(135.35kg/ha), 콩(120.97kg/ha)이었습니다. 1차 영양소는 작물에 필수적이며 대사 과정을 촉진하고 세포, 세포막, 엽록소 등 식물에 필수적인 조직 형성에 기여합니다. 특히 인은 고품질 작물의 재배에 필수적이며 칼륨은 식물의 성장에 필요한 효소의 활성화에 매우 중요한 역할을 하고 있습니다.
세계 규모에서는 농작물의 질소, 칼륨, 인의 평균 양분 시용량은 164.31kg/ha입니다. 가장 널리 사용되는 주요 양분으로는 질소가 1위이며, 시용량은 224.6kg/ha, 그 다음으로 칼륨이 150.3kg/ha입니다. 인은 3위이며 2022년 소비량은 117.9kg/ha입니다.
2022년의 질소 시용량은 유채가 가장 많이 347.4kg/ha였습니다. 인의 시용량은 옥수수가 156.3kg/ha로 1위, 칼륨의 시용량은 카놀라가 248.6kg/ha로 1위입니다.
농작물의 재배는 세계적으로 증가하고 있으며, 남미와 아시아태평양에서의 성장이 두드러집니다. 이 지역들은 비료의 주요 시장으로 대두되고 있습니다. 유럽이나 북미와 같은 개발 선진 지역은, 영양 부족으로 고민하는 지역과 함께, 그 유효성을 요구해 특수 비료에 눈을 돌리게 되어 있습니다. 이러한 역학은 향후 수년간 주 영양 비료 시장을 활성화시킬 것으로 보입니다.
인산 비료 산업 개요
인산 비료 시장은 단편화되어 있으며 상위 5개사에서 13.55%를 차지하고 있습니다. 이 시장 주요 기업은 다음과 같습니다. Coromandel International Ltd., EuroChem Group, Indian Farmers Fertiliser Cooperative Limited, Nutrien Ltd. and PhosAgro Group of Companies.(알파벳순 정렬)
기타 혜택
엑셀 형식 시장 예측(ME) 시트
3개월의 애널리스트 서포트
목차
제1장 주요 요약 및 주요 조사 결과
제2장 보고서 제안
제3장 서문
조사의 전제조건 및 시장 정의
조사 범위
조사 방법
제4장 주요 산업 동향
주요 작물의 작부 면적
농작물
원예작물
평균 양분 시용률
주요 양분
농작물
원예작물
관개 설비가 있는 농지
규제 프레임워크
밸류체인 및 유통 채널 분석
제5장 시장 세분화
유형별
스트레이트
인계
DAP
MAP
SSP
TSP
기타
시비 모드별
시비
잎면 살포
토양
작물 유형별
농작물
원예작물
잔디 및 관상용
지역별
아시아태평양
호주
방글라데시
중국
인도
인도네시아
일본
파키스탄
필리핀
태국
베트남
기타 아시아태평양
유럽
프랑스
독일
이탈리아
네덜란드
러시아
스페인
우크라이나
영국
기타 유럽
중동 및 아프리카
나이지리아
사우디아라비아
남아프리카
튀르키예
기타 중동 및 아프리카
북미
캐나다
멕시코
미국
기타 북미
남미
아르헨티나
브라질
기타 남미
제6장 경쟁 구도
주요 전략 동향
시장 점유율 분석
기업 상황
기업 프로파일
Coromandel International Ltd.
EuroChem Group
Indian Farmers Fertiliser Cooperative Limited
KS Aktiengesellschaft
Koch Industries Inc.
Nutrien Ltd.
PhosAgro Group of Companies
SABIC Agri-Nutrients Co.
제7장 CEO에 대한 주요 전략적 질문
제8장 부록
세계 개요
개요
Porter's Five Forces 분석 프레임워크
세계의 밸류체인 분석
시장 역학(DROs)
정보원 및 참고문헌
도표 일람
주요 인사이트
데이터 팩
용어집
AJY
영문 목차
영문목차
The Phosphatic Fertilizer Market size is estimated at 57.91 billion USD in 2025, and is expected to reach 82.33 billion USD by 2030, growing at a CAGR of 7.29% during the forecast period (2025-2030).
Reducing phosphorous content in the soils and the need for the element in crop growth may drive the market
Diammonium phosphate (DAP) dominated the phosphatic fertilizer market in 2022, capturing a significant 41.3% global consumption share, equivalent to 30.9 million metric tons. Its popularity stems from its composition, with 46.0% phosphate and 18.0% ammonium, serving as a nitrogen source. This made DAP the top choice for farmers worldwide. The market value of DAP reached USD 23.3 billion in 2022.
Monoammonium phosphate (MAP) emerged as the second most favored phosphatic fertilizer, trailing behind DAP. The global MAP market, valued at USD 11.3 billion in 2022, witnessed a consumption volume of 15.3 million metric tons. Notably, MAP boasts a water-soluble P content of around 90%, surpassing the crop growth requirements.
Triple superphosphate (TSP), a pure phosphate-based fertilizer with the highest phosphate content of 46.0%, accounted for 21.1% of global phosphate fertilizer consumption in 2022. The TSP market is poised for growth, especially with the expansion of legume crop cultivation areas.
Single superphosphate (SSP) constituted 16.7% of global phosphatic fertilizer consumption in 2022. SSP finds significant usage in oilseed crops, owing to its role in providing crucial sulfur trace elements for edible oils and calcium nutrients in acidic soils. These factors indicate a potential uptick in SSP usage in the coming years.
The phosphatic fertilizer market is projected to witness robust growth, with an estimated CAGR of 7.0% from 2023 to 2030. This growth is primarily driven by the escalating global demand for phosphatic fertilizers as more farmers seek to enhance their crop yields.
The need to improve productivity and rising demand to address the phosphate deficiency are expected to fuel the growth of the market
The Asia-Pacific region dominated the global phosphatic fertilizer market and accounted for about 58.6% of the total market value, accounting for about USD 32.8 billion in 2022. In 2022, DAP occupied a market share of 49.8% in the Asia-Pacific phosphatic fertilizers market. The greater demand for DAP in the region is due to its greater efficiency than other phosphatic fertilizers like TSP and SSP.
China was the world's leading producer of phosphorus fertilizers, accounting for nearly 10.3% value share of the global phosphatic fertilizer market in 2022. Its exports represented approximately 25.3% of the world's exports. The top importers from China are Indonesia, Australia, and Iran.
North America secured the second-largest market share at 10.6%. Phosphatic fertilizers, after nitrogen fertilizers, are the second most crucial nutrient source for crops. In North America, mono ammonium phosphate (MAP) and diammonium phosphate (DAP) dominated the market in 2022, with shares of 66.3% and 30.9%, respectively. The high phosphate content in MAP drove its demand.
In 2022, the South American phosphatic fertilizer market held a 20.3% share of the global market, and it is projected to register a CAGR of 6.9% during 2023-2030.
The global phosphatic fertilizer market has witnessed a consistent upward trajectory in both value and volume, barring a dip in 2020, primarily attributed to the disruptions caused by the COVID-19 pandemic. However, the market value is expected to rebound during 2023-2030, driven by a decline in global cultivation areas.
Global Phosphatic Fertilizer Market Trends
The rising pressure on the agriculture industry to meet the growing food demand is expected to increase the area under field crop cultivation
The global agricultural sector grapples with numerous challenges. The United Nations projects a world population surpassing 9 billion by 2050, potentially straining an agricultural industry already struggling with labor shortages and shrinking fields due to urbanization. The Food and Agriculture Organization predicts that by 2050, 70% of the global population will reside in urban areas. With arable land dwindling worldwide, farmers are increasingly relying on fertilizers to bolster crop yields in an effort to meet the rising demand for food.
The Asia-Pacific region stands as the leading global agricultural producer, with agriculture employing roughly 20% of its workforce. Field crop cultivation dominates, encompassing over 95% of the region's crop area. Rice, wheat, and corn, collectively occupying 24.3% of the crop area in 2022, are the primary field crops in the region, which is a testament to the region's agricultural diversity and productivity.
North America ranks as the second-largest arable region globally, boasting a diverse crop portfolio with a focus on field crops. Notably, corn, cotton, rice, soybean, and wheat take center stage, as highlighted by the USDA. In 2022, the United States commanded 46.2% of North America's crop cultivation area. However, adverse environmental conditions, including severe flooding in regions like Texas and Houston, led to a significant drop in the country's crop acreage between 2017 and 2019, underscoring the vulnerability of agricultural production to climate change.
Canola has the highest application rate of potassic fertilizers globally, with an average application rate of 248.6 kg/ha
Corn, rapeseed, cotton, sorghum, rice, wheat, and soybean are prominent crops globally, known for their high nutrient requirements. The average primary nutrient application rates for these crops in 2022 were as follows: corn (230.57 kg/ha), rapeseed (255.75 kg/ha), cotton (172.70 kg/ha), sorghum (158.46 kg/ha), rice (154.49 kg/ha), wheat (135.35 kg/ha), and soybean (120.97 kg/ha). Primary nutrients are vital for crops, facilitating metabolic processes and contributing to the formation of essential plant tissues, including cells, cell membranes, and chlorophyll. Notably, phosphorus is crucial for cultivating high-quality crops, while potassium plays a pivotal role in activating enzymes necessary for plant growth.
On a global scale, field crops have an average nutrient application rate of 164.31 kg/ha for nitrogen, potassium, and phosphorus. Nitrogen takes the lead as the most widely used primary nutrient, with an application rate of 224.6 kg/ha, followed by potassium at 150.3 kg/ha. Phosphorus ranks third, with a consumption rate of 117.9 kg/ha in 2022.
In 2022, rapeseed had the highest nitrogen application rate at 347.4 kg/ha. Corn led in phosphorus application at 156.3 kg/ha, and canola topped in potassium application at 248.6 kg/ha.
Field crop cultivation is rising globally, with notable growth in South America and Asia-Pacific. These regions are emerging as key markets for fertilizers. Developed regions like Europe and North America, along with areas grappling with nutrient deficiencies, are increasingly turning to specialty fertilizers for their efficacy. These dynamics are poised to fuel the primary nutrient fertilizers market in the coming years.
Phosphatic Fertilizer Industry Overview
The Phosphatic Fertilizer Market is fragmented, with the top five companies occupying 13.55%. The major players in this market are Coromandel International Ltd., EuroChem Group, Indian Farmers Fertiliser Cooperative Limited, Nutrien Ltd. and PhosAgro Group of Companies (sorted alphabetically).
Additional Benefits:
The market estimate (ME) sheet in Excel format
3 months of analyst support
TABLE OF CONTENTS
1 EXECUTIVE SUMMARY & KEY FINDINGS
2 REPORT OFFERS
3 INTRODUCTION
3.1 Study Assumptions & Market Definition
3.2 Scope of the Study
3.3 Research Methodology
4 KEY INDUSTRY TRENDS
4.1 Acreage Of Major Crop Types
4.1.1 Field Crops
4.1.2 Horticultural Crops
4.2 Average Nutrient Application Rates
4.2.1 Primary Nutrients
4.2.1.1 Field Crops
4.2.1.2 Horticultural Crops
4.3 Agricultural Land Equipped For Irrigation
4.4 Regulatory Framework
4.5 Value Chain & Distribution Channel Analysis
5 MARKET SEGMENTATION (includes market size in Value in USD and Volume, Forecasts up to 2030 and analysis of growth prospects)
5.1 Type
5.1.1 Straight
5.1.1.1 Phosphatic
5.1.1.1.1 DAP
5.1.1.1.2 MAP
5.1.1.1.3 SSP
5.1.1.1.4 TSP
5.1.1.1.5 Others
5.2 Application Mode
5.2.1 Fertigation
5.2.2 Foliar
5.2.3 Soil
5.3 Crop Type
5.3.1 Field Crops
5.3.2 Horticultural Crops
5.3.3 Turf & Ornamental
5.4 Region
5.4.1 Asia-Pacific
5.4.1.1 Australia
5.4.1.2 Bangladesh
5.4.1.3 China
5.4.1.4 India
5.4.1.5 Indonesia
5.4.1.6 Japan
5.4.1.7 Pakistan
5.4.1.8 Philippines
5.4.1.9 Thailand
5.4.1.10 Vietnam
5.4.1.11 Rest of Asia-Pacific
5.4.2 Europe
5.4.2.1 France
5.4.2.2 Germany
5.4.2.3 Italy
5.4.2.4 Netherlands
5.4.2.5 Russia
5.4.2.6 Spain
5.4.2.7 Ukraine
5.4.2.8 United Kingdom
5.4.2.9 Rest of Europe
5.4.3 Middle East & Africa
5.4.3.1 Nigeria
5.4.3.2 Saudi Arabia
5.4.3.3 South Africa
5.4.3.4 Turkey
5.4.3.5 Rest of Middle East & Africa
5.4.4 North America
5.4.4.1 Canada
5.4.4.2 Mexico
5.4.4.3 United States
5.4.4.4 Rest of North America
5.4.5 South America
5.4.5.1 Argentina
5.4.5.2 Brazil
5.4.5.3 Rest of South America
6 COMPETITIVE LANDSCAPE
6.1 Key Strategic Moves
6.2 Market Share Analysis
6.3 Company Landscape
6.4 Company Profiles
6.4.1 Coromandel International Ltd.
6.4.2 EuroChem Group
6.4.3 Indian Farmers Fertiliser Cooperative Limited