인도의 방출 조절 비료(CRF) 시장 : 시장 점유율 분석, 산업 동향 및 통계, 성장 예측(2025-2030년)
India Controlled Release Fertilizer - Market Share Analysis, Industry Trends & Statistics, Growth Forecasts (2025 - 2030)
상품코드:1693511
리서치사:Mordor Intelligence
발행일:2025년 03월
페이지 정보:영문
라이선스 & 가격 (부가세 별도)
ㅁ Add-on 가능: 고객의 요청에 따라 일정한 범위 내에서 Customization이 가능합니다. 자세한 사항은 문의해 주시기 바랍니다.
ㅁ 보고서에 따라 최신 정보로 업데이트하여 보내드립니다. 배송기일은 문의해 주시기 바랍니다.
한글목차
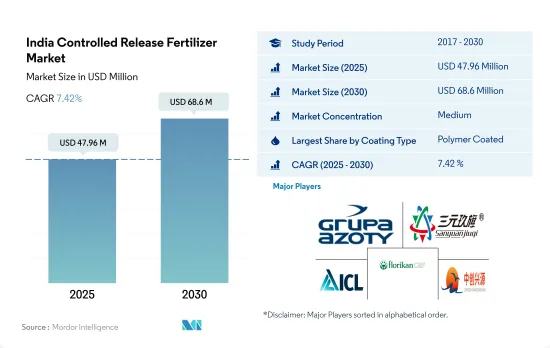
인도의 방출 조절 비료 시장 규모는 2025년 4,796만 달러로 추정되고, 2030년에는 6,860만 달러에 이를 전망이며, 예측 기간인 2025-2030년 CAGR 7.42%를 나타낼 것으로 예측됩니다.
높은 질소 요구량과 지속 가능한 농법이 CRF 수요를 증가시키고 있습니다.
방출 조절 비료는 영양분의 방출 기간을 3, 6, 12, 15개월로 연장하는 혁신적인 기술이며, 밀, 쌀, 옥수수 등 주요 작물의 성장을 더욱 지원하기 위해 국내에서의 채용이 증가하고 있습니다.
이 나라의 방출 조절 비료 시장은 2017-2021년 소비량이 24.2% 증가한 반면 시장 가치는 106.1% 증가했습니다. 그 주된 이유는 인도 정부가 요소의 국내 전체 생산자에 대해 100% 님코트 요소의 생산과 농가에 보조금이 붙은 가격으로 유통하도록 의무화한 것입니다.
경작 면적의 90.0%를 농작물이 차지하고 있기 때문에 2022년의 소비량은 89.5%를 차지하였고, 농작물이 시장을 독점하고 있습니다. 인도의 주요 농작물로는 쌀, 밀, 잡곡, 옥수수, 콩류, 지방종자 등이 있으며, 이들 작물은 성장단계를 통해 높은 질소 함유량을 필요로 합니다.
방출 조절 요소는 인도에서 가장 많이 사용되고 있는 CRF입니다. 질소 손실은 벼농사 농가가 직면한 주요 문제 중 하나이며 휘발이나 용탈로 인한 질소 손실이 커 벼의 질소 이용 효율은 종종 미흡합니다. 질소 이용 효율을 향상시키는 한 가지 방법은 방출 조절 요소를 사용하는 것입니다. 방출 조절 요소 비료는 일반적으로 질소 손실을 줄이고 식물의 성장을 촉진하며 질소 농도를 높인다는 점에서 입상 요소비료보다 우수합니다.
건강에 대한 우려의 고조는 사람들이 건강과 관련된 문제를 심각하게 받아들이도록 촉구하고 있습니다. 환경오염에 대한 관심 고조와 CRF의 용출이 없다는 특성은 이 나라의 방출 조절 비료 시장에 긍정적인 영향을 주고 있으며, 2023-2030년 CAGR 4.5%를 기록할 것으로 예상되고 있습니다.
인도의 방출 조절 비료 시장 동향
곡물 재배가 활발한 인도가 비료 시장을 견인할 것으로 예측
인도 농작물의 재배 면적은 조사 기간 동안 3.5% 증가했습니다. 국내외 소비자 수요의 증가로 곡물, 콩류, 지방종자의 재배가 증가하고 있는 것이 재배 면적 증가의 주된 요인입니다. 작물 종류별로는 쌀, 밀, 콩의 재배 면적이 가장 크며, 2022년에는 4,700만㏊, 3,110만㏊, 1,230만㏊를 차지했습니다. 쌀은 인도에서 가장 중요한 식용 작물이며, 작부 면적의 약 4분의 1을 차지하며, 인도 인구의 약 절반에게 식량을 공급하고 있습니다. 서벵골주, 우타르프라데시주, 안도라프라데시주, 펀자브주, 타밀나두주를 중심으로 거의 전 국토에서 재배되고 있습니다.
이에 따라 이 나라의 쌀 소비량은 2016년 9,580만 톤에서 2022년에는 1억 700만 톤으로 증가했으며, 이는 이 나라의 작물에 대한 수요가 증가하고 있음을 보여줍니다. 이 추세는 2023-2030년 비료 수요를 더욱 높일 것으로 예상됩니다. 마찬가지로 국내 밀 재배는 2017년 9,850만 톤에서 2020년 1억 760만 톤으로 증가했습니다. 펀잡, 서벵골, 할리야나, 라자스탄에서 주로 재배됩니다. 밀은 인도에서 두 번째로 중요한 곡물 작물이며, 이 나라의 식량 및 영양 안전에 중요한 역할을 하고 있습니다. 따라서 이 나라에서는 곡물 재배가 활발해 국내외 수요가 증가함에 따라 예측 기간 동안 인도 비료 시장의 견인역이 될 것으로 예상됩니다.
1차 영양소 중에서 질소는 농작물에서 가장 적용되는 영양소이며, 평균 적용량은 헥타르당 223.5kg입니다.
2022년의 1차 영양소 전체의 평균 시용량은 125.1kg/ha로, 질소 등 영양소의 평균 시용량은 223.5kg/ha로 가장 높았습니다. 따라서, 질소는 국내에서 집중적으로 재배되고 있는 벼 등의 작물의 주요한 양분원이며, 이러한 토양의 양분 부족이 전국의 벼의 생산성을 제한하고 있습니다.
인도의 바이오 비료 및 유기 비료의 현상은 화학 비료의 소비량이 증가함에 따라 토양의 건강 상태가 나쁘다는 것을 보여줍니다. 그 결과, 검사한 토양의 97.0%, 83.0%, 71.0%가 각각 질소, 인, 칼륨이 부족한 것으로 밝혀졌습니다.
작물별로는 2022년 평균 양분 시용량이 가장 많은 작물은 밀, 쌀, 옥수수 및 메이즈로 각각 231kg/ha, 156kg/ha, 149kg/ha로 평가되었습니다. 밀과 쌀은 국내적으로도 세계적으로도 중요한 주식입니다. 여러 영양 결핍이 수확량과 이익을 감소시키는 중요한 요인입니다. 밀과 쌀 작물은 질소, 인, 칼륨 외에 황, 붕소, 철, 아연 등의 미량영양소를 적절한 성장과 개발에 필요로 합니다. 작물 생산을 성공시키기 위해서는 양분의 적절한 관리가 필요하며, 이것이 시장 성장의 원동력이 되고 있습니다.
농작물은 질소 비료 등의 1차 영양소를 최대한으로 소비합니다. 국내에서는 곡물과 곡류가 집중적으로 재배되고 있기 때문에 토양의 영양이 고갈되고 있어 이를 보충하기 위해 비료가 더 많이 필요합니다.
인도의 방출 조절 비료 산업 개요
인도의 방출 조절 비료 시장은 적당히 통합되어 있으며 상위 5개사에서 58.57%를 차지하고 있습니다. 이 시장 주요 기업은 다음과 같습니다. Grupa Azoty S.A.(Compo Expert), Hebei Sanyuanjiuqi Fertilizer, ICL Group Ltd, New Mountain Capital(Florikan)and Zhongchuang xingyuan chemical technology(알파벳순).
기타 혜택
엑셀 형식 시장 예측(ME) 시트
3개월의 애널리스트 서포트
목차
제1장 주요 요약 및 주요 조사 결과
제2장 보고서 제안
제3장 서문
조사의 전제조건 및 시장 정의
조사 범위
조사 방법
제4장 주요 산업 동향
주요 작물의 작부 면적
농작물
원예작물
평균 양분 시용률
주요 양분
농작물
원예작물
규제 프레임워크
밸류체인 및 유통 채널 분석
제5장 시장 세분화
코팅 유형별
폴리머 코팅
폴리머 유황 코팅
기타
작물 유형별
농작물
원예작물
잔디 및 관상용
제6장 경쟁 구도
주요 전략 동향
시장 점유율 분석
기업 상황
기업 프로파일
Grupa Azoty SA(Compo Expert)
Haifa Group
Hebei Sanyuanjiuqi Fertilizer Co., Ltd.
ICL Group Ltd
New Mountain Capital(Florikan)
Zhongchuang xingyuan chemical technology co.ltd
제7장 CEO에 대한 주요 전략적 질문
제8장 부록
세계 개요
개요
Porter's Five Forces 분석 프레임워크
세계의 밸류체인 분석
시장 역학(DROs)
정보원 및 참고문헌
도표 일람
주요 인사이트
데이터 팩
용어집
AJY
영문 목차
영문목차
The India Controlled Release Fertilizer Market size is estimated at 47.96 million USD in 2025, and is expected to reach 68.6 million USD by 2030, growing at a CAGR of 7.42% during the forecast period (2025-2030).
High nitrogen requirements and sustainable agricultural practices are increasing the demand for CRFs
The adoption of controlled-release fertilizers is increasing more in the country as this is an innovative technique that extends nutrient release time by 3, 6, 12, or even 15 months, which gives additional support to the growth of major crops, such as wheat, rice, and maize.
The controlled-release fertilizer market in the country witnessed an increase in market value by 106.1%, whereas the consumption volume increased by 24.2% during 2017-2021. The main reason for this was the Government of India making it mandatory for all domestic producers of urea to produce 100% neem-coated urea and distribute it at a subsidized price to the farmers.
Field crops dominated the market, with consumption volume accounting for 89.5% in 2022 as field crops occupied 90.0% of the cultivated area. Major field crops in India include rice, wheat, millet, maize, pulses, and oilseeds, which require high nitrogen content throughout their growth stages.
Controlled-release urea is the most used form of CRF in India. Nitrogen loss is one of the main problems faced by rice farmers, and the efficiency of nitrogen utilization in rice is often inadequate due to the large loss of nitrogen caused by volatilization and leaching. One way to improve nitrogen efficiency is to use controlled-release urea. Controlled-release urea fertilizers generally outperform granular urea fertilizers in reducing nitrogen loss, stimulating plant growth, and increasing nitrogen concentration.
Growing concerns regarding health have pushed people to take health-related problems seriously. Increasing inclination toward environmental pollution and the no-leaching property of CRF are positively influencing the controlled-release fertilizer market in the country, which is expected to record a CAGR of 4.5% from 2023 to 2030.
India Controlled Release Fertilizer Market Trends
The intense cereal cultivation in the country is anticipated to drive the Indian fertilizer market
The area under field crop cultivation in the country increased by 3.5% during the study period. The increased cultivation of cereals, pulses, and oilseeds in the country due to the rising consumer demand domestically and internationally is the major driving factor for the rising acreage. By crop type, rice, wheat, and soybean occupied the largest area under cultivation in the country, accounting for 47 million ha, 31.1 million ha, and 12.3 million ha in 2022. Rice is the most important food crop of India, covering about one-fourth of the total cropped area and providing food to about half of the Indian population. It is cultivated in almost all the states of the country, mainly in West Bengal, Uttar Pradesh, Andhra Pradesh, Punjab, and Tamil Nadu.
Accordingly, rice consumption in the country increased from 95.8 million tons in 2016 to 107 million tons in 2022, which shows the rising demand for the crop in the country. This trend is further anticipated to drive the demand for fertilizers during 2023-2030. Similarly, wheat cultivation in the country increased from 98.5 million tons in 2017 to 107.6 million tons in 2020. It is cultivated majorly in Punjab, West Bengal, Haryana, and Rajasthan. Wheat is the second most important cereal crop in India and plays a vital role in the country's food and nutritional security. Therefore, the intense cereal cultivation in the country, coupled with rising domestic and international demand, is anticipated to drive the Indian fertilizer market during the forecast period.
Among the primary nutrients, nitrogen is the most-applied nutrient in field crops, with an average application rate of 223.5 kg per hectare
The overall primary nutrient average application rate in 2022 was 125.1 kg/ha, with nutrients such as nitrogen with the highest average application rate of 223.5 kg/ha. Accordingly, nitrogen is the major source of nutrients for crops such as rice, which is intensively cultivated in the country, and such nutrient deficiency in soil is limiting rice productivity across the nation.
The State of Biofertilizers and Organic Fertilizers in India marked the poor status of soil health, with increasing consumption of chemical fertilizers in India. Accordingly, 97.0%, 83.0%, and 71.0% of the soil tested were found to be deficient in nitrogen, phosphorous, and potassium, respectively.
By crop, wheat, rice, and corn/maize are estimated to be the crop types with the highest average nutrient application rate of 231, 156, and 149 kg/ha in 2022. Wheat and rice are important staple food domestically and globally. Multiple nutrient deficiencies are the key factors that reduce yield and profit. Wheat and rice crops require nitrogen, phosphorous, and potassium, along with other micronutrients such as sulfur, boron, iron, and zinc, for their proper growth and development. The proper management of nutrients is necessary for successful crop production, which is driving market growth.
Field crops consume the maximum amount of primary nutrients, such as nitrogen fertilizer. As grains and cereals are intensively grown in the country, the soil is depleted of its nutrition, and hence, they require more fertilizers to supplement them, which, in turn, is anticipated to drive the market during 2023-2030.
India Controlled Release Fertilizer Industry Overview
The India Controlled Release Fertilizer Market is moderately consolidated, with the top five companies occupying 58.57%. The major players in this market are Grupa Azoty S.A. (Compo Expert), Hebei Sanyuanjiuqi Fertilizer Co., Ltd., ICL Group Ltd, New Mountain Capital (Florikan) and Zhongchuang xingyuan chemical technology co.ltd (sorted alphabetically).
Additional Benefits:
The market estimate (ME) sheet in Excel format
3 months of analyst support
TABLE OF CONTENTS
1 EXECUTIVE SUMMARY & KEY FINDINGS
2 REPORT OFFERS
3 INTRODUCTION
3.1 Study Assumptions & Market Definition
3.2 Scope of the Study
3.3 Research Methodology
4 KEY INDUSTRY TRENDS
4.1 Acreage Of Major Crop Types
4.1.1 Field Crops
4.1.2 Horticultural Crops
4.2 Average Nutrient Application Rates
4.2.1 Primary Nutrients
4.2.1.1 Field Crops
4.2.1.2 Horticultural Crops
4.3 Regulatory Framework
4.4 Value Chain & Distribution Channel Analysis
5 MARKET SEGMENTATION (includes market size in Value in USD and Volume, Forecasts up to 2030 and analysis of growth prospects)
5.1 Coating Type
5.1.1 Polymer Coated
5.1.2 Polymer-Sulfur Coated
5.1.3 Others
5.2 Crop Type
5.2.1 Field Crops
5.2.2 Horticultural Crops
5.2.3 Turf & Ornamental
6 COMPETITIVE LANDSCAPE
6.1 Key Strategic Moves
6.2 Market Share Analysis
6.3 Company Landscape
6.4 Company Profiles
6.4.1 Grupa Azoty S.A. (Compo Expert)
6.4.2 Haifa Group
6.4.3 Hebei Sanyuanjiuqi Fertilizer Co., Ltd.
6.4.4 ICL Group Ltd
6.4.5 New Mountain Capital (Florikan)
6.4.6 Zhongchuang xingyuan chemical technology co.ltd