아시아태평양의 LED 조명 시장 : 시장 점유율 분석, 산업 동향, 성장 예측(2025-2030년)
Asia Pacific LED Lighting - Market Share Analysis, Industry Trends & Statistics, Growth Forecasts (2025 - 2030)
상품코드:1692162
리서치사:Mordor Intelligence
발행일:2025년 03월
페이지 정보:영문
라이선스 & 가격 (부가세 별도)
ㅁ Add-on 가능: 고객의 요청에 따라 일정한 범위 내에서 Customization이 가능합니다. 자세한 사항은 문의해 주시기 바랍니다.
ㅁ 보고서에 따라 최신 정보로 업데이트하여 보내드립니다. 배송기일은 문의해 주시기 바랍니다.
한글목차
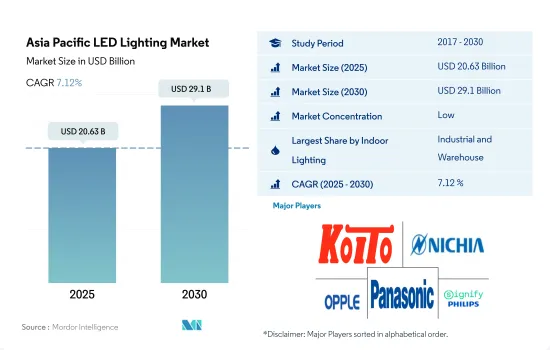
아시아태평양의 LED 조명 시장 규모는 2025년에 206억 3,000만 달러로 추정되고, 2030년에는 291억 달러에 이를 것으로 예측되며, 예측 기간(2025-2030년) 중 CAGR 7.12%로 성장할 전망입니다.
산업부문 및 주택부문 개발 증가로 시장 성장 견인
금액 점유율에서는 2023년에는 산업과 창고가 점유율의 대부분을 차지했습니다. 중국은 2022년 세계 2위 경제대국입니다. 중국의 창고 공간 비용은 코로나19 이전에는 1평방미터당 월평균 44.3위안(6.15달러)이었습니다. 중국에서는 창고 수요가 꾸준히 증가하면서 팬데믹 이후 임대 비용이 상승하고 있습니다. 중국 창고업계의 수익은 5년간 연 4.3% 증가할 것으로 전망됩니다.
마찬가지로 인도에서는 제조업이 팬데믹 전에 인도의 GDP의 16-17%를 벌어내고 있으며, 가장 급성장하는 분야 중 하나가 될 것으로 예상되고 있습니다. 인도의 공업 및 창고 분야에서는, 약 1,100만 평방피트의 견조한 흡수가 보고되고 있어 수요의 77%를 티어 I 도시가 견인하고 있습니다. 이러한 요인으로 인해 LED 보급 수요가 증가할 것으로 예상됩니다.
수량 점유율에서는 2023년에는 주택이 점유율의 대부분을 차지했습니다. 지난 30년 동안 아시아는 높은 도시화율을 경험했습니다. 급속한 도시화는 경제 성장을 가속하는 데 일조했지만, 주택에 대한 큰 수요를 초래해, 주택 가격의 상승을 초래했습니다. 일본에서는 인구 감소에 따른 정부의 주택 정책의 영향도 있어, 2023년에는 1,000만 호 공급 과잉이 된 것으로 평가되었습니다. 가구 수는 2023년에 5,419만 가구에서 피크를 맞이했습니다. 이러한 요인은 주요 LED 수요에 대응하는 것입니다.
새로운 주택의 도입에는 정부 보조금이 큰 역할을 합니다. 인도에서는 정부가 몇 가지 에너지 절약 프로그램을 도입하고 있습니다. 예를 들어, 중앙정부의 야심찬 PMAY(Pradhan Mantri Awas Yojana) 프로그램은 2022년까지 전국에서 2,000만 호의 저렴한 도영 주택을 건설하는 것을 목표로 하고 있습니다. 이러한 요인으로 인해 대규모 판매가 이루어지고 향후 LED 수요가 증가할 수 있습니다.
각국의 부동산 인프라 개발 및 자동차 분야의 왕성한 수요가 시장 수요 증가
2023년 금액과 수량 점유율에서 중국이 가장 많고 인도가 2위입니다. 중국은 소지대국이며 90% 이상의 가구가 집을 소유하고 있습니다. 동시에 중국 가구의 20% 이상이 여러 주택을 소유하고 있으며 많은 선진국보다 높습니다. 이러한 통계는 LED 조명 수요를 촉진할 수 있습니다.
중국의 자동차 총 생산은 2021년에는 10조 위안(1조 4,000억 달러) 이상이 되어 중국의 GDP의 거의 10%에 공헌했습니다. 자동차 시장의 강력한 성장은 정책적 인센티브, 자본 지원, 소비자 수요 증가로 인한 것입니다. 2022년 5월 중국은 농촌 지역에서 신에너지 차량(NEV) 판매를 촉진하는 정책을 발표했습니다.
인도 기업은 2022년 인프라와 부동산 투자 신탁을 통해 3조 5,000억 루피 이상의 자금을 조달한 것으로 평가되었습니다. 상위 8개 도시의 오피스 시장은 2020년 7월부터 2020년 12월까지 22.2msf의 거래를 기록했습니다. 현재, 인도에서는 1조 3,000억 달러에 상당하는 대규모 인프라 산업 프로젝트가 진행되고 있습니다. 이러한 개발이 LED 조명의 수요를 촉진하고 있습니다.
인도의 자동차 산업은 인도의 GDP에 6.4% 가까이 공헌하고 있습니다. 2019년 마하라슈트라주, 구자라트주, 델리주, 카르나타카주 등 1인당 소득이 높은 주의 자동차 판매량은 업계 평균보다 빠르게 축소되었습니다. 택시 애그리게이터와 승용차 소유자의 포화 상태 고조가 자동차 판매 성장에 타격을 주고 있습니다. 2019년 10월 현재 LED는 후미등에서 40% 이상의 보급률을 얻었지만 헤드램프에서는 15% 미만의 점유율에 그쳤습니다. 자동차 판매량 증가에 따라 후미등과 헤드램프 LED의 점유율은 크게 증가할 것으로 예상됩니다.
아시아태평양 LED 조명 시장 동향
주택 건설 및 판매 증가가 LED 시장 성장을 견인
아시아태평양은 세계 인구의 60%를 옹호하는 지역입니다. 이 지역의 많은 국가, 특히 중국은 인구 증가율 톱 10에 들어 있습니다. 중국의 저사회경제층에서는 2019년 현재 주민의 60% 이상이 거주하고 있습니다. 대도시 시민과 비교하면 소유율은 상당히 높습니다. 저층의 시나 마을에서는, 소유 주택의 41%가 주택 융자를 받지 않았습니다. LED 사용이 증가한 것은 중국의 주택 구입 증가가 영향을 미치고 있는지도 모릅니다. 게다가 인도에서는, 기업이 추진하는 캠페인에 의해서, LED 기술을 신속하고 광범위하게 도입하는 것이 가능하다는 것을 나타내고 있습니다.
기타 국가들의 건설 업계는 원주민과 이민 인구가 함께 급속히 증가함에 따라 번영하고 있습니다. 예를 들어 인도네시아에서는 2017년에 5%, 2019년에 1% 주택건축량이 증가했으며, 이 동향은 각국의 인구 증가로 예측 기간을 통해 지속될 것으로 보입니다. 그 결과 아시아 태평양 건축 분야의 급확대는 지역 시장의 LED 수요를 증가시킬 전망입니다.
2021년 시점에서 아시아태평양에서 가장 가구수가 많은 것은 중국으로, 총 가구수는 4억 4,970만을 넘습니다. 또한, 인도, 인도네시아, 일본에서는 각각 2억 9 510만 가구, 6,890만 가구, 4,850만 가구로 되어 있습니다. 이들 국가의 가구 수는 꾸준히 증가하고 있어 아시아태평양 지역에서 더 많은 주택이 건설되고 LED 수요가 높아지고 있음을 시사하고 있습니다. 2022년 아시아태평양에서 판매된 승용차 3,750만 대 중 2,360만 대 이상이 중국이었습니다. 이와 비교해 아시아태평양에서는 2021년에 약 3,457만 대의 승용차가 판매되었습니다. 이 지역의 LED 수요는 아시아태평양의 자동차 판매량 증가가 뒷받침합니다.
LED 시장을 견인하는 것은 인구 증가, 1인당 소득 증가 및 정부 보조금
아시아태평양은 세계 인구의 59.7%, 약 47억 명을 보유하고 있으며 중국과 인도 등 세계에서 가장 인구가 많은 국가를 포함해, 인구의 46.3%가 도시 인구입니다(2019년 21억 4,0 00만 명). 이 지역 전체의 출생률은 여성 1인당 2.1명에 가깝습니다. 가족 인원은 동아시아에서는 여성 1인당 1.7명까지 감소했지만 남아시아에서는 여성 1인당 2.5명의 높은 수준을 유지하고 있습니다. 또한 이 지역에서는 현재 5명 중 2명이 도시 지역에 살고 있습니다. 수백만 명이 일자리와 더 나은 기회를 찾아 시골에서 마을이나 도시로 이주하기 때문에 이 비율은 앞으로 몇 년 동안 크게 증가할 것으로 보입니다. 따라서 도시 지역의 가구 수 증가로 이 지역의 조명 요구에 대한 LED 보급이 진행될 것으로 예상됩니다.
이 지역에는 여러 신흥 국가가 포함되어 있으며, 팬데믹에도 불구하고 가처분 소득은 개발 도상국에서 늘어나고 있습니다. 중국의 1인당 소득은 2021년 12월 12,615.7달러에 비해 2022년 12월 12,732.5달러에 달했습니다. 인도의 1인당 소득은 2021년 3월 1971.6달러에 비해 2022년 3월에는 2301.4달러에 달했습니다. 일본의 1인당 소득은 2021년 12월 39,916.1달러에 비해 2022년 12월에는 33,911.2달러에 달했습니다. 그 결과 개인의 소비력이 높아지고 새로운 주거 공간에 더 많은 자금이 투입되게 됩니다. 가정용으로는, 2012년에 중국 정부가 LED 사용에 대해 22억 위안(3억 1,000만 달러)의 보조금을 제공했습니다. 일본 정부는 2010년 4월, '에코 포인트'로 알려진 소비자용 리베이트 제도를 도입했습니다. 사용자는 에코포인트를 사용해 에코포인트 2대 1 비율로 LED 램프를 구매할 수 있어 LED 조명 수요를 더욱 급증시킬 것으로 기대됩니다.
아시아태평양의 LED 조명 산업 개요
아시아태평양의 LED 조명 시장은 단편화되어 있으며 주요 기업 5개사에서 26.83%를 차지하고 있습니다. 이 시장의 주요 기업은 다음과 같습니다. KOITO MANUFACTURING, Nichia Corporation, OPPLE Lighting, Panasonic Holdings Corporation and Signify Holding(Philips)(알파벳순 정렬).
기타 혜택
엑셀 형식 시장 예측(ME) 시트
3개월의 애널리스트 서포트
목차
제1장 주요 요약 및 주요 조사 결과
제2장 보고서 제안
제3장 서문
조사의 전제조건 및 시장 정의
조사 범위
조사 방법
제4장 주요 산업 동향
자동차 생산 대수
인구
1인당 소득
자동차 대출 금리
충전소 수
자동차 주행 대수
LED 총 수입량
조명 소비 전력
#가구수
도로망
LED 보급률
#경기장수
원예 면적
규제 프레임워크
실내 조명
중국
인도
일본
옥외 조명
중국
인도
일본
자동차용 조명
중국
인도
일본
한국
밸류체인 및 유통 채널 분석
제5장 시장 세분화
실내 조명별
농업용 조명
상업 조명
사무실
소매
기타
산업 및 창고
주택 조명
옥외 조명별
공공시설
도로
기타
자동차용 유틸리티 조명별
데이터임 러닝 라이트(DRL)
방향 지시기
헤드라이트
리버스 라이트
스톱라이트
테일 라이트
기타
자동차용 조명별
이륜차
상용차
승용차
국가별
중국
인도
일본
기타 아시아태평양
제6장 경쟁 구도
주요 전략 동향
시장 점유율 분석
기업 상황
기업 프로파일
EGLO Leuchten GmbH
GRUPO ANTOLIN IRAUSA, SA
KOITO MANUFACTURING CO., LTD.
Marelli Holdings Co., Ltd.
Nichia Corporation
OPPLE Lighting Co., Ltd
OSRAM GmbH.
Panasonic Holdings Corporation
Signify Holding(Philips)
Stanley Electric Co., Ltd.
제7장 CEO에 대한 주요 전략적 질문
제8장 부록
세계 개요
개요
Porter's Five Forces 분석 프레임워크
세계의 밸류체인 분석
시장 역학(DROs)
정보원 및 참고문헌
도표 일람
주요 인사이트
데이터 팩
용어집
AJY
영문 목차
영문목차
The Asia Pacific LED Lighting Market size is estimated at 20.63 billion USD in 2025, and is expected to reach 29.1 billion USD by 2030, growing at a CAGR of 7.12% during the forecast period (2025-2030).
Increasing development in the industrial sector and residential sector drives the market growth
In terms of value share, in 2023, industrial and warehouse accounts for most of the share. China is the second-largest economy in the world as of 2022. Warehouse space in China cost an average of CNY 44.3 (USD 6.15) per square meter per month during pre-COVID-19. In China, there has been a steady rise in the demand for warehouses, raising the cost of renting them post-pandemic. Revenue for the storage industry in China is expected to increase at an annualized 4.3% over the five years.
Similarly, in India, manufacturing generated 16-17% of India's GDP before the pandemic and is expected to be one of the fastest-growing sectors. India's industrial and warehousing sector reported a nearly 11 million square feet robust absorption, with tier-I cities driving 77% of the demand. Such factors are expected to increase the LED penetration demand.
In terms of volume share, in 2023, residential accounts for most of the share. Over the past three decades, Asia experienced a high urbanization rate. While rapid urbanization helped to fuel economic growth, it has led to major demand for housing, resulting in high housing prices. Japan will likely see an excess supply of 10 million dwelling units in 2023, partly due to government housing policy with a shrinking population. The number of households will peak at 54.19 million in 2023. Such a factor caters to a major LED demand.
Government subsidy plays a major role in the adoption of new housing. In India, the government has introduced several energy-saving programs. For example, the central government's ambitious Pradhan Mantri Awas Yojana (PMAY) program aims to build 20 million affordable metropolitan housing units nationwide by 2022. Such factors might lead to major sales, leading to more LED demand in the coming period.
Increase in development in real estate infrastructure and strong demand in automotive sector in various countries increase the market demand
In terms of value and volume share, in 2023, China comprised most of the share, and India stood second. China is a country of homeowners, with more than 90% of households owning homes. At the same time, more than 20% of Chinese households own multiple homes, higher than many developed nations. Such stats may propel the demand for LED lighting.
China's automobile gross output was more than CNY 10 trillion (USD 1.4 trillion) in 2021, contributing to almost 10% of China's GDP. The strong growth of the automotive market can be attributed to policy incentives, capital support, and increasing consumer demand. In May 2022, China released a policy to boost new energy vehicle (NEV) sales in rural parts.
Indian firms were expected to raise more than INR 3.5 trillion through infrastructure and real estate investment trusts in 2022. The office market in the top eight cities recorded transactions of 22.2 msf from July 2020 to December 2020. In 2022, office absorption in the top seven cities stood at 38.25 million sq. ft. Currently, India is undertaking major infrastructure and industrial projects worth USD 1.3 trillion. Such development fuels the demand for LED lighting.
The Indian automobile industry contributes almost 6.4% to India's GDP. As of 2019, vehicle sales in higher per capita income states such as Maharashtra, Gujarat, Delhi, and Karnataka were shrinking faster than the industry average. Taxi aggregators and rising saturation among passenger car owners have hit vehicle sales growth. As of October 2019, LEDs gained more than 40% penetration in tail lamps, but they accounted for less than 15% of the share in headlamps. With increasing vehicle sales, the shares of tail lamps and headlamp LEDs are expected to increase significantly.
Asia Pacific LED Lighting Market Trends
Increase in construction and sales of residential houses to drive the growth of the LED market
Asia-Pacific is home to 60% of the world's population. Numerous nations in the region, notably China, are in the top ten in terms of population growth. In China's lower socioeconomic strata, as of 2019, more than 60% of residents were homeowners. In comparison to citizens of big cities, the ownership rate was substantially greater. In lower-tier cities and towns, 41% of homeowners did not have a mortgage on their home. The increased use of LEDs may be influenced by the rise in home purchases in China. Moreover, India has shown that it is possible to install LED technology quickly and extensively via campaigns promoted by the companies.
The other nations' construction industries are prospering as their native and immigrant populations both grow quickly. For instance, the volume of residential buildings climbed by 5% in Indonesia in 2017 and by 1% in 2019, and this trend will continue throughout the forecast period due to the countries' growing populations. As a result, the rapidly expanding building sector in Asia-Pacific will increase the demand for LEDs in the regional market.
China had the most households in Asia-Pacific as of 2021, with a total of over 449.7 million. In addition, there are 295.1 million, 68.9 million, and 48.5 million households in India, Indonesia, and Japan, respectively. There is a steady rise in the number of households in these nations, which suggests that more homes are being built and that the demand for LEDs in the Asia-Pacific is rising. Over 23.6 million of the 37.5 million passenger cars sold in 2022 in Asia-Pacific were in China. Comparatively, Asia-Pacific sold about 34.57 million passenger cars in 2021. The demand for LEDs in the region will be aided by the rise in automotive vehicle sales in Asia-Pacific.
The LED market is driven by increasing population, rising per capita income, and government subsidies
Asia-Pacific is home to 59.7% of the world's population, which is around 4.7 billion people, and includes the world's most populous countries, such as China and India, and 46.3 % of the population is urban (2.14 billion people in 2019). The region's overall fertility rate is close to 2.1 births per woman. Family size has decreased to 1.7 children per woman in East Asia while maintaining a high of 2.5 children per woman in South Asia. Further, two out of every five people in the region currently live in urban areas. This ratio will increase significantly in the coming years as millions move from the countryside to towns and cities in search of employment and better opportunities. Thus, the increase in the number of households in urban areas is expected to create more LED penetration for need for illumination in region.
This region includes several developing nations, and despite pandemic, disposable income is growing in developing countries. China's per capita income reached USD 12,732.5 in December 2022, compared to USD 12,615.7 in December 2021. India's per capita income reached USD 2301.4 in March 2022, compared to USD 1971.6 in March 2021. Japan's per capita income reached USD 33,911.2 in December 2022, compared to USD 39,916.1 in December 2021. Such instances result in the rising spending power of individuals and affording more money for new residential spaces. For households, in 2012, the Chinese government offered a subsidy of CNY 2.2 billion (USD 0.31 billion) for the use LEDs. The Japanese government introduced a consumer rebate program known as the "Eco-Point" program in April 2010. Users may use their Eco-Points to purchase LED lamps at a 2 to 1 Eco-point ratio, which is further expected to surge the demand for LED lighting.
Asia Pacific LED Lighting Industry Overview
The Asia Pacific LED Lighting Market is fragmented, with the top five companies occupying 26.83%. The major players in this market are KOITO MANUFACTURING CO., LTD., Nichia Corporation, OPPLE Lighting Co., Ltd, Panasonic Holdings Corporation and Signify Holding (Philips) (sorted alphabetically).
Additional Benefits:
The market estimate (ME) sheet in Excel format
3 months of analyst support
TABLE OF CONTENTS
1 EXECUTIVE SUMMARY & KEY FINDINGS
2 REPORT OFFERS
3 INTRODUCTION
3.1 Study Assumptions & Market Definition
3.2 Scope of the Study
3.3 Research Methodology
4 KEY INDUSTRY TRENDS
4.1 Automotive Production
4.2 Population
4.3 Per Capita Income
4.4 Interest Rate For Auto Loans
4.5 Number Of Charging Stations
4.6 Number Of Automobile On-road
4.7 Total Import Of Leds
4.8 Lighting Electricity Consumption
4.9 # Of Households
4.10 Road Networks
4.11 Led Penetration
4.12 # Of Stadiums
4.13 Horticulture Area
4.14 Regulatory Framework
4.14.1 Indoor Lighting
4.14.1.1 China
4.14.1.2 India
4.14.1.3 Japan
4.14.2 Outdoor Lighting
4.14.2.1 China
4.14.2.2 India
4.14.2.3 Japan
4.14.3 Automotive Lighting
4.14.3.1 China
4.14.3.2 India
4.14.3.3 Japan
4.14.3.4 South Korea
4.15 Value Chain & Distribution Channel Analysis
5 MARKET SEGMENTATION (includes market size in Value in USD and Volume, Forecasts up to 2030 and analysis of growth prospects)
5.1 Indoor Lighting
5.1.1 Agricultural Lighting
5.1.2 Commercial
5.1.2.1 Office
5.1.2.2 Retail
5.1.2.3 Others
5.1.3 Industrial and Warehouse
5.1.4 Residential
5.2 Outdoor Lighting
5.2.1 Public Places
5.2.2 Streets and Roadways
5.2.3 Others
5.3 Automotive Utility Lighting
5.3.1 Daytime Running Lights (DRL)
5.3.2 Directional Signal Lights
5.3.3 Headlights
5.3.4 Reverse Light
5.3.5 Stop Light
5.3.6 Tail Light
5.3.7 Others
5.4 Automotive Vehicle Lighting
5.4.1 2 Wheelers
5.4.2 Commercial Vehicles
5.4.3 Passenger Cars
5.5 Country
5.5.1 China
5.5.2 India
5.5.3 Japan
5.5.4 Rest of Asia-Pacific
6 COMPETITIVE LANDSCAPE
6.1 Key Strategic Moves
6.2 Market Share Analysis
6.3 Company Landscape
6.4 Company Profiles (includes Global level Overview, Market level overview, Core Business Segments, Financials, Headcount, Key Information, Market Rank, Market Share, Products and Services, and analysis of Recent Developments)