ㅁ Add-on 가능: 고객의 요청에 따라 일정한 범위 내에서 Customization이 가능합니다. 자세한 사항은 문의해 주시기 바랍니다.
ㅁ 보고서에 따라 최신 정보로 업데이트하여 보내드립니다. 배송기일은 문의해 주시기 바랍니다.
한글목차
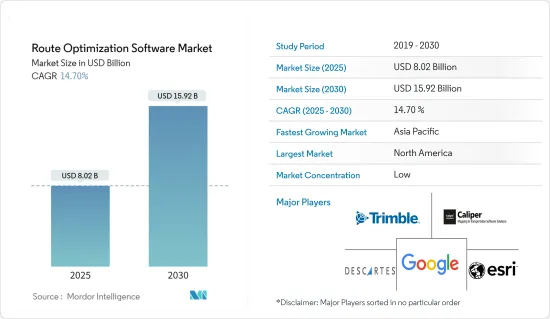
루트 최적화 소프트웨어 시장 규모는 2025년에 80억 2,000만 달러에 이를 것으로 추정됩니다. 예측 기간(2025-2030년)의 CAGR은 14.7%를 나타내고, 2030년에는 159억 2,000만 달러에 달할 것으로 전망됩니다.
루트 최적화 소프트웨어는 가장 효율적인 차량 루트를 계획, 일정, 계산하고 시간과 비용을 절약합니다. 루트 최적화 소프트웨어는 여러 정차 역, 고객과의 협의 및 제품 배달이 있는 경우에 유용합니다. 이 소프트웨어는 시나리오 테스트와 과거 데이터를 활용하여 어떤 루트가 가장 느리거나 가장 붐비는지 판단하기 위해 교통 정체를 피합니다.
이 설문 조사 시장 수치는 주문형 음식 배달, 소매, FMCG, 필드 서비스, 라이드 헤일링 및 택시 서비스를 포함한 다양한 최종 사용자의 수익을 보여줍니다. 음식, 소매, 전자상거래, 물류 등 일부 산업에서는 온디맨드 음식 배달, 소매 및 식료품 배달 서비스, 전자상거래 배달 등의 배달 서비스를 제공하기 위한 비즈니스 프로세스의 변화가 진행되고 있습니다. 이러한 개발은 루트 최적화 소프트웨어 수요 증가를 크게 뒷받침할 것으로 예상됩니다.
연료가격이 급등하는 가운데 배송비용 상승은 불가피하며 물품 수요에 영향을 미치며 물류업계 수익과 이익 저하를 야기하고 있습니다. 기업은 맞춤형 물류 루트 최적화 솔루션에서 함대 트루트 최적화 및 관리에 중점을 두고 있으며, 물류 기업은 배송 비용을 유지하고 고객 만족도를 유지하며 시간과 주행 거리를 줄임으로써 이익을 높이는 데 주력하고 있습니다.
기존의 물류 시스템은 하드웨어에 대한 투자를 늘려야 하고 확장성 제약으로 이어지는 경우가 많습니다. 그러나 클라우드 기반 솔루션의 출현으로 기업은 비용을 절감하면서 비교할 수 없는 유연성을 얻을 수 있게 되었습니다. 물류 공급자는 비즈니스를 확장하고 수요 변동과 비즈니스 성장에 대응할 수 있습니다. 대부분의 클라우드 솔루션은 구독 모델에서 작동하므로 하드웨어 및 소프트웨어를 구입하는 것보다 저렴한 가격으로 사용할 수 있습니다. 하드웨어 비용이 낮기 때문에 기업은 필요한 서버, 저장 장치 및 고성능 네트워크 장비에 투자할 수 있습니다.
루트 최적화 소프트웨어의 정확도는 기본 데이터의 품질에 따라 다릅니다. 따라서 데이터와 관련된 부정확성은 최적이 아닌 루트 결정, 비효율적인 리소스 활용, 소프트웨어에 대한 고객의 불만을 초래할 수 있습니다. 예를 들어, 루트 최적화 소프트웨어가 구조화되지 않은 데이터 패턴을 고려할 수 없는 경우 비효율적인 루트가 되어 배송 불량으로 이어질 수 있습니다.
COVID-19의 대유행은 세계 사람들의 삶과 사업에 영향을 미칩니다. COVID-19의 유행이 계속되는 동안, 운송업자는 몇몇 장애에 직면하고 있습니다. 단단한 조임으로 인해 인터넷에서 식료품 구매가 증가하고 있습니다. 인터넷 사용자 증가는 도표에 보이는 것과 같이 현저합니다. 슈퍼마켓 납품에 대한 이러한 수요 증가는 전자상거래, 온라인 소매, 식료품 회사에게 시간이 지남에 따라 물자를 납품하는 데 큰 장애물이 되었습니다. 이러한 상황의 결과로, 루트 최적화 소프트웨어 분야는 유행 기간과 유행 후 현재에 번영하고 있습니다.
루트 최적화 소프트웨어 시장 동향
온디맨드 음식 배달이 큰 성장을 이룰 것으로 예상
COVID 이후의 시대, 온디맨드 식품 택배는 세계에서 가장 급성장하고 있는 산업의 하나가 되었습니다. 이 업계에서는 유행 후에 새로운 온디맨드 식품 전달 사업이 출현하여 성장을 보였습니다. 신속한 배달에 대한 고객의 기대가 증가함에 따라 음식 배달 사업은 최대 효율을 달성하고 비용을 최소화하면서 적시 배달을 보장하기 위해 루트 최적화 소프트웨어에 대한 수요가 필요했습니다.
온디맨드 푸드 딜리버리에 대한 소비자 수요가 급격히 변화하고 있는 가운데, 푸드 딜리버리 비즈니스가 성공하기 위해서는 기술이 필수적이 되고 있습니다. 패스트 푸드 레스토랑 체인의 경우 온라인 주문은 빠르게 비즈니스의 주요 부분이되었습니다. 따라서 정확한 ETA 계산 및 커뮤니케이션으로 신속한 배달을 통해 최종 고객 경험을 향상시키는 루트 최적화 소프트웨어에 대한 수요가 급속히 증가하고 있습니다.
세계에서 스마트폰이 보급되고 인터넷이 침투하여 온라인 주문이 촉진되었습니다. GSMA의 Mobile Economy 2023에 따르면 북미 스마트폰 보급률은 전체 모바일 연결의 84%를 차지했고 2030년까지 90%로 증가할 것으로 예상됩니다.
밀레니얼 세대가 기존의 외식에서 다양한 온디맨드 푸드 딜리버리 서비스로 지향을 변화함에 따라, 푸드 딜리버리 사업자는 온디맨드 푸드 딜리버리 서비스에 주력하고 있어 예측 기간 중에 루트 최적화 소프트웨어를 채용할 기회를 창출하고 있습니다.
아시아태평양이 큰 시장 점유율을 차지할 전망
아시아태평양에서는 도시화와 인구 증가가 현저하고 중국, 인도, 일본 등 주요 국가에서는 정체와 도시 교통의 혼잡이 증가하고 있습니다. 이러한 이유로 DHL, FedEx, Bluedart 등의 물류기업은 기업이 도시를 효율적으로 이동하고 배송 시간과 연료 소비를 줄이는 데 도움이 되는 루트 최적화 소프트웨어를 사용하기 시작했으며, 이 지역에서 루트 최적화 소프트웨어 수요를 촉진하고 있습니다.
아시아에서는 음식 배달, 식료품 배달, 라이드 헤일링 등 온디맨드 서비스의 인기가 급속히 높아지고 있습니다. Zepto, Blinkit, Zomato 등 온디맨드 딜리버리를 제공하는 많은 기업들이 아시아에서 사업을 시작하고 있습니다. 따라서 이러한 기업에서는 루트 최적화 솔루션의 도입이 진행되고 있습니다. 루트 최적화 솔루션은 주문형 딜리버리 루트를 최적화하고 효율성을 높이고 고객 만족도를 높이는 데 매우 중요합니다.
또한 세계화가 진행됨에 따라 아시아태평양에서는 효율적인 크로스 보더 물류 솔루션에 대한 수요가 증가하고 있습니다. 루트 최적화 솔루션은 국경을 넘는 루트 계획 및 최적화, 통관 절차 관리 및 적시 배송을 보장하는 기업을 지원합니다.
또한 이 지역에서는 전자상거래 활동의 급증으로 배송량이 증가하고 있습니다. 루트 최적화 소프트웨어는 소매업체와 FMCG 기업이 상품을 다양한 장소로 배송할 때 복잡한 관리를 지원하여 배송 속도를 높이고 비용을 절감합니다.
따라서 아시아태평양의 루트 최적화 소프트웨어에 대한 수요 증가는 기업이 비용을 절감하고 효율성을 높이고 고객의 기대를 높일 필요성을 뒷받침하고 있습니다. 루트 최적화 솔루션을 활용함으로써 기업은 새로운 기회를 끌어올리고 물류 과제를 극복하고 역동적이고 빠르게 진화하는 아시아태평양 시장에서 성공을 거둘 수 있습니다.
루트 최적화 소프트웨어 시장 개요
루트 최적화 소프트웨어 시장은 세분화되어 있으며 경쟁 시장에서 세계 기업와 지역 기업로 구성되어 있습니다. 이 시장은 신규 진출기업에 있어서 진입 장벽이 높은 것, 복수의 신규 진출기업이 견인역이 되고 있습니다 : Trimble Inc., Caliper Corporation, The Descartes Systems Group Inc., ESRI Global Inc., Google LLC(알파벳순 정렬).
2024년 2월 - Descartes Systems Group은 Arctic Glacier가 데카르트의 전략적 경로 계획 솔루션을 사용하여 100개 이상의 시설과 1,000대의 차량으로 미국과 캐나다 전역의 75,000개 고객 위치로 얼음 유통을 최적화함으로써 유통 네트워크 효율성, 차량 성능 및 고객 경험을 개선했다고 발표했습니다.
2023년 9월 - 트림블은 정시 배송, 자산 활용 및 고객 서비스를 개선하는 다중 매장, 다중 차량 루트 최적화를 위한 클라우드 기반 솔루션인 Appian Daily Planner를 발표했습니다.
기타 혜택 :
엑셀 형식 시장 예측(ME) 시트
3개월간의 애널리스트 서포트
목차
제1장 서론
조사의 전제조건과 시장 정의
조사 범위
제2장 조사 방법
제3장 주요 요약
제4장 시장 인사이트
시장 개요
업계의 매력도 - Porter's Five Forces 분석
공급기업의 협상력
구매자의 협상력
신규 참가업체의 위협
대체품의 위협
경쟁도
산업 밸류체인 분석
매크로 동향이 시장에 미치는 영향
제5장 시장 역학
시장 성장 촉진요인
물류에 특화된 솔루션의 이용 증가
하드웨어 및 연결 비용 감소
시장 성장 억제요인
구조화 데이터와 비구조화 데이터의 취급
제6장 시장 세분화
최종 사용자 업계별
온디맨드 음식 배달
소매 및 FMCG
현장 서비스
차량 호출 및 택시 서비스
기타 최종 사용자 업계
조직 규모별
중소기업
대기업
배포 형태별
클라우드
온프레미스
지역별
북미
유럽
아시아태평양
라틴아메리카
중동 및 아프리카
제7장 경쟁 구도
기업 프로파일
Trimble Inc.
Caliper Corporation
The Descartes Systems Group Inc.
ESRI Global Inc.
Google LLC(알파벳순 정렬)
TrackoBit(InsightGeeks Solutions Pvt. Ltd)
Microlise Group PLC
Omnitracs LLC
Ortec BV
Paragon Software Systems PLC
PTV Planung Transport Verkehr GMBH
Route4me LLC
Routific Solutions Inc.
Verizon Connect Solutions Inc.
WorkWave LLC
제8장 투자 분석
제9장 시장의 미래
KTH
영문 목차
영문목차
The Route Optimization Software Market size is estimated at USD 8.02 billion in 2025, and is expected to reach USD 15.92 billion by 2030, at a CAGR of 14.7% during the forecast period (2025-2030).
Route optimization software plans, schedules, and calculates the most efficient vehicle route, saving time and money. Route optimization software comes in handy when there are several stops, client meetings, and product delivery. This software avoids traffic congestion by utilizing scenario testing and historical data to determine which route is the slowest or busiest.
The study's market numbers indicate the revenue generated from various end users, such as on-demand food delivery, retail and FMCG, field services, ride-hailing and taxi services, and other end-user verticals. Several industries, such as food and beverages, retail and e-commerce, and logistics, are increasingly transforming their business processes to provide delivery services, including on-demand food delivery, retail and grocery delivery services, and e-commerce delivery. Such developments are expected to boost route optimization software's increasing demand significantly.
With fuel prices soaring, delivery costs are inevitably rising, impacting demand for goods and causing a drop in revenue and profit for the logistics industry. Businesses emphasize optimizing and managing their fleet routes with a custom logistics route optimization solution, and logistics companies focus on retaining their delivery costs, keeping customers satisfied, and making more profit through reductions in time and mileage.
Traditional logistics systems often require increased hardware investments, leading to scalability constraints. However, with the advent of cloud-based solutions, enterprises can now gain unparalleled flexibility at reduced costs. Logistics providers can scale their operations, accommodating demand fluctuations and business growth. Most cloud solutions operate on a subscription model, making it more affordable than purchasing hardware and software. With declining hardware costs, enterprises can invest in the required servers, storage devices, and networking equipment for high performance.
The accuracy of route optimization software depends on the quality of underlying data. Thus, inaccuracy related to data may lead to suboptimal route decisions, inefficient resource utilization, and customer dissatisfaction with the software. For example, if the route optimization software cannot account for unstructured data patterns, it may lead to inefficient routes, resulting in poor delivery.
The COVID-19 pandemic has had an influence on everyone's lives and businesses throughout the world. During the continuing COVID-19 outbreak, delivery companies confront several obstacles. Due to the lockdown limitations, there has been an increase in internet grocery buying. The growth in internet users has been significant, as indicated in the graph; this increased demand for supermarket delivery poses a significant barrier for e-commerce, online retail, and grocery firms to deliver supplies on time. As a result of these circumstances, the route optimization software sector flourished during the pandemic and the current post-pandemic period.
Route Optimization Software Market Trends
On-demand Food Delivery to Witness Significant Growth
In the post-COVID era, on-demand food delivery has become one of the fastest-growing industries worldwide. The industry witnessed growth in the emergence of new on-demand food delivery businesses post-pandemic. Evolving customer expectations for fast delivery have necessitated the demand for route optimization software to help food delivery businesses achieve maximum efficiency and ensure timely delivery while minimizing expenses.
With the dramatic shifts in consumer demand for on-demand food delivery, technologies are becoming critical for food delivery businesses to thrive. Online food ordering has quickly become a major part of the business for fast-food restaurant chains. Therefore, the demand for route optimization software is quickly gaining traction to deliver fast with accurate ETA calculation and communication to improve the end-customer experience.
The high adoption of smartphones across the world and internet penetration prompted online food ordering. According to the Mobile Economy 2023 of GSMA, North America's smartphone adoption rate accounts for 84% of the total mobile connections, and it is expected to increase to 90% by 2030, along with regions like CIS and Asia-Pacific forecast to register larger growth.
Along with millennials shifting their inclinations from conventional eat-out to various on-demand food delivery services, food delivery businesses are focusing on on-demand food delivery services, thus creating an opportunity to adopt route optimization software over the forecast period.
Asia-Pacific is Expected to Hold Significant Market Share
The Asia-Pacific region is experiencing significant urbanization and population growth, leading to increased congestion and city traffic congestion in major countries such as China, India, and Japan. Due to this, logistic companies such as DHL, FedEx, Bluedart, and others have started using route optimization software that helps businesses navigate urban areas efficiently, reducing delivery times and fuel consumption, which is driving the demand for route optimization software in the region.
The popularity of on-demand services, including food delivery, grocery delivery, and ride-hailing, is growing rapidly in Asia. Many companies such as Zepto, Blinkit, Zomato, and others that offer on-demand delivery have started in Asia. Hence, these companies are increasingly adopting route optimization solutions. Route optimization solutions are crucial in optimizing routes for on-demand deliveries, improving efficiency, and enhancing customer satisfaction.
In addition, with increasing globalization, there is a growing demand for efficient cross-border logistics solutions in the Asia-Pacific region. Route optimization solutions assist businesses in planning and optimizing cross-border routes, managing customs procedures, and ensuring timely deliveries.
Additionally, the surge in e-commerce activities in the region has led to a higher volume of deliveries. Route optimization software helps retailers and FMCG companies manage the complexities of delivering goods to diverse locations, improving delivery speed and reducing costs.
Therefore, the rising demand for route optimization software in the Asia-Pacific region is driven by the need for businesses to reduce costs, improve efficiency, and meet customers' growing expectations. By utilizing route optimization solutions, businesses can unlock new opportunities, overcome logistical challenges, and position themselves for success in the dynamic and rapidly evolving Asia-Pacific market.
Route Optimization Software Market Overview
The route optimization software market is fragmented and comprises global and regional players in the competitive market space. Although the market poses high barriers to entry for the new players, several new entrants have gained traction: Trimble Inc., Caliper Corporation, The Descartes Systems Group Inc., ESRI Global Inc., Google LLC (Alphabet Inc.)
February 2024 - Descartes Systems Group announced that Arctic Glacier improved its distribution network efficiency, fleet performance, and customer experience by using Descartes' strategic route planning solution to optimize ice distribution from over 100 facilities and 1,000 vehicles to 75,000 customer locations across the United States and Canada.
September 2023 - Trimble introduced Appian Daily Planner, a cloud-based solution for multi-stop, multi-vehicle route optimization that improves on-time deliveries, asset utilization, and customer service.
Additional Benefits:
The market estimate (ME) sheet in Excel format
3 months of analyst support
TABLE OF CONTENTS
1 INTRODUCTION
1.1 Study Assumptions and Market Definition
1.2 Scope of the Study
2 RESEARCH METHODOLOGY
3 EXECUTIVE SUMMARY
4 MARKET INSIGHTS
4.1 Market Overview
4.2 Industry Attractiveness - Porter's Five Forces Analysis
4.2.1 Bargaining Power of Suppliers
4.2.2 Bargaining Power of Buyers
4.2.3 Threat of New Entrants
4.2.4 Threat of Substitutes
4.2.5 Degree of Competition
4.3 Industry Value Chain Analysis
4.4 Impacts of Macro Trends on the Market
5 MARKET DYNAMICS
5.1 Market Drivers
5.1.1 Increasing Use of Logistics-Specific Solutions