미국의 데이터센터 - 시장 점유율 분석, 산업 동향 및 통계, 성장 예측(2025-2030년)
United States Data Center - Market Share Analysis, Industry Trends & Statistics, Growth Forecasts (2025 - 2030)
상품코드:1690080
리서치사:Mordor Intelligence
발행일:2025년 03월
페이지 정보:영문
라이선스 & 가격 (부가세 별도)
ㅁ Add-on 가능: 고객의 요청에 따라 일정한 범위 내에서 Customization이 가능합니다. 자세한 사항은 문의해 주시기 바랍니다.
ㅁ 보고서에 따라 최신 정보로 업데이트하여 보내드립니다. 배송기일은 문의해 주시기 바랍니다.
한글목차
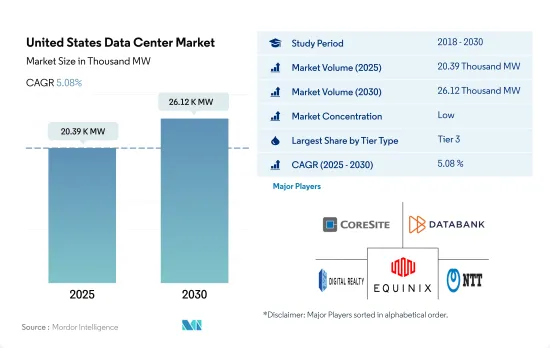
미국의 데이터센터 시장 규모는 2025년 2만 390kW에 달하고, 2030년 2만 6,120kW에 이르며 CAGR은 5.08%를 나타낼 것으로 예측됩니다.
또한 2025년 코로케이션 수익은 240억 3,640만 달러, 2030년에는 386억 7,530만 달러에 이를 것으로 예상되며, 예측 기간(2025-2030년)의 CAGR은 9.98%를 나타낼 것으로 전망됩니다.
2023년에는 Tier 3 데이터센터가 수량 기준으로 대부분의 점유율을 차지
Tier 3 데이터센터는 국내에서 가장 선호됩니다.
중소기업은 일반적으로 Tier 3랭크의 시설을 선호합니다.
티어 4 데이터센터는 99.995%의 업타임을 제공하기 때문에 주로 대기업에 이어 선호되고 있습니다. 2016년 연간 376.2엑사바이트에서 2021년에는 955.7엑사바이트에 이르렀으며, 보다 중복된 효율적인 시설에 대한 수요 증가를 시사하고 있습니다.
Tier 1과 Tier 2의 데이터센터는 Tier 1의 기대 가동 시간이 99.671%(연간 다운타임 28.8시간)인 반면, Tier 2의 기대 가동 시간은 99.741%(연간 다운타임 22시간)이기 때문에 가장 선호되지 않습니다. 니의 요구에 대해 비용 효율적인 옵션을 요구하는 중소기업에 자주 이용되고 있습니다.
미국의 데이터센터 시장 동향
화상 통화, 점포 내 쇼핑 체험 확장, 원격 의료 서비스, 모바일 게임 개선 등의 이용이 증가하여 시장 성장을 견인
5G나 FWA 등의 기술을 지원하는 광범위한 파이버 연결 등 보다 빠른 대체 네트워크의 도입으로 스마트폰에 의한 데이터 소비량은 2018년의 1.8GB에서 2022년에는 CAGR 24.7%를 나타내 약 8.5GB로 증가했습니다. 이 소비량은 2029년까지 33.6%의 연평균 성장률로 64GB 이상으로 더욱 증가할 것으로 예상됩니다.
인터넷 가속화와 이어지는 액세스 가능한 장치의 보급은 지역에서의 데이터 소비 결정과 추정에 중요한 역할을 합니다. 높은 것을 보여줍니다. 사용자는 5G 네트워크를 통한 활동의 일부로 향상된 화상 통화, 확장된 상점에서의 쇼핑 경험, 원격 의료 서비스, 개선된 모바일 게임을 매우 매력적이거나 매우 매력적이라고 생각하며, 이것이 데이터 이용에 기여하고 있습니다.
YouTube가 약 74%, Gmail이 61%, Facebook이 59%, Google 검색 앱이 58%로 계속됩니다. 침투하고 이용되고 있는 것을 나타내고 있습니다.이것은 이러한 미디어가 실행해, 유저 데이터를 보존하기 위해서 필요한 메모리·플랫폼을 제공하는 데이터·스토리지의 필요성을 부조로 해, 데이터 처리 설비에 대한 보다 큰 수요를 낳고 있습니다.
스마트폰 보급과 5G 연결 증가가 시장 성장 견인
미국은 북미와 세계의 스마트폰 포트폴리오 모두에서 중요한 시장입니다. 토폰의 판매 대수가 증가해 국내 스마트폰 전체의 대수도 증가합니다.
게다가 2022년 1월에 발표된 데이터는 스마트폰 판매액이 17억 달러 증가했으며, 2021년 약 730억 달러에 대해 2022년에는 총액 약 747억 달러에 이르는 것으로 나타났습니다.
스마트폰 수 증가는 국내 모바일 무선 가입자 연결 수 증가를 통해 관찰되었으며, 2019년 약 4억 4,250만에서 2021년에는 약 4억 9,891만으로 증가했습니다. 예측 기간 중, 5G는 데이터 포인트 증가를 통해 데이터 생성에 크게 공헌해, 데이터를 보존·처리하기 위해서 보다 많은 데이터센터에 수요를 만들어 내는 것으로 예상됩니다.
미국의 데이터센터 산업 개요
미국의 데이터센터 시장은 세분화되어 있으며 상위 5개 기업에서 16.24%를 차지하고 있습니다. 이 시장의 주요 업체는 CoreSite(America Tower Corporation), 데이터뱅크 홀딩스, 디지털 리얼티 트러스트, 주식회사, 에퀴닉스, 주식회사, NTT 주식회사 등입니다.(알파벳순 정렬).
기타 혜택
엑셀 형식 시장 예측(ME) 시트
3개월간의 애널리스트 서포트
목차
제1장 주요 요약과 주요 조사 결과
제2장 보고서 제안
제3장 서론
조사의 전제조건과 시장 정의
조사 범위
조사 방법
제4장 시장 전망
IT 부하 용량
바닥 공간 증가
코로케이션 수익
설치 랙 수
랙 공간 활용
해저 케이블
제5장 주요 업계 동향
스마트폰 사용자수
스마트폰 1대당 데이터 트래픽
모바일 데이터 속도
광대역 데이터 속도
광섬유 접속 네트워크
규제 프레임워크
미국
밸류체인과 유통채널 분석
제6장 시장 세분화
핫스팟
애틀랜타
오스틴
보스턴
시카고
달라스
휴스턴
로스앤젤레스
뉴저지
뉴욕
북 캘리포니아
버지니아 북부
북서부
피닉스
솔트레이크시티
미국의 다른 지역
데이터센터의 규모
대규모
초대규모
중규모
메가
소규모
티어 유형
Tier 1 및 2
Tier 3
Tier 4
흡수량
비이용
이용
코로케이션 유형별
하이퍼스케일
소매
도매
최종 사용자별
BFSI
클라우드
전자상거래
정부기관
제조
미디어 및 엔터테인먼트
통신
기타 최종 사용자
제7장 경쟁 구도
시장 점유율 분석
기업 상황
기업 프로파일
CoreSite(America Tower Corporation)
CyrusOne Inc.
Cyxtera Technologies
Databank Holdings Ltd
Digital Realty Trust, Inc.
Equinix, Inc.
Flexential Corp.
H5 Data Centers LLC
NTT Ltd.
Quality Technology Services
Switch
Vantage Data Centers, LLC
LIST OF COMPANIES STUDIED
제8장 CEO에 대한 주요 전략적 질문
제9장 부록
세계의 개요
개요
Porter's Five Forces 분석 프레임워크
세계의 밸류체인 분석
세계 시장 규모와 DRO
정보원과 참고문헌
도표 목록
주요 인사이트
데이터 팩
용어집
KTH
영문 목차
영문목차
The United States Data Center Market size is estimated at 20.39 thousand MW in 2025, and is expected to reach 26.12 thousand MW by 2030, growing at a CAGR of 5.08%. Further, the market is expected to generate colocation revenue of USD 24,036.4 Million in 2025 and is projected to reach USD 38,675.3 Million by 2030, growing at a CAGR of 9.98% during the forecast period (2025-2030).
Tier 3 data center accounted for majority share in terms of volume in 2023
Tier 3 data centers are the most preferred in the country. They operated at an IT load capacity of 5,319.6 MW in 2022. Tier 3 data centers have redundant and dual-powered servers, storage, network links, and other IT components. As of 2022, the country had 399 tier 3 data centers. Around 73 data centers are under construction with Tier 3 standards.
SMEs generally prefer a Tier 3-rated facility. SMEs are a vital component of the US economy, as they comprise 99.9% of active enterprises. End users such as BFSI and telecom are focusing on hyperscale colocation services.
Tier 4 data centers are the next most preferred, mainly by large enterprises, as they provide 99.995% uptime. However, high cost is the major factor for the low adoption of these facilities. With the data traffic generation, upcoming data centers are expected to follow Tier 4 standards. In the United States, IP traffic reached an annual run rate of 955.7 exabytes in 2021, up from an annual run rate of 376.2 exabytes in 2016, suggesting the growing demand for more redundant and efficient facilities. As a result, tier 4 data centers are expected to hold the highest market share of 48.9% in 2029, followed by tier 3 facilities with a share of 45.4%.
Tier 1 & 2 data centers are the least preferred as tier 1 has an expected uptime of 99.671% (28.8 hours of downtime annually), while tier 2 has an expected uptime of 99.741% (22 hours of downtime annually). These data centers are commonly utilized by small businesses looking for a cost-effective option for their data storage needs. However, due to lower functionality, even SMEs are focusing on adopting wholesale colocation services with a Tier 3 certification. Therefore, tier 1 & 2 DCs are expected to showcase the lowest growth.
United States Data Center Market Trends
Increase use of video calling, augmented in-store shopping experiences, remote health services, and improved mobile gaming to drive market growth
With the introduction of faster network alternatives, such as 5G and extensive fiber connectivity supporting technologies like FWA, data consumption through smartphones increased from 1.8 GB in 2018 to about 8.5 GB in 2022 at a CAGR of 24.7%. This consumption is expected to further increase to more than 64 GB by 2029, at a CAGR of 33.6%. As 5G drives smartphone adoption and upgrades, the market will witness more data generating points, leading to increased data consumption that leverages higher wireless network speeds.
Faster internet and the subsequent penetration of devices capable of accessing it play a crucial role in determining and estimating data consumption in a region. Data suggests that the number of 5G mobile connections in the United States will increase from 15% in 2021 to about 68% by 2025, signifying high 5G mobile penetration in the country. Users find enhanced video calling, augmented in-store shopping experiences, remote health services, and improved mobile gaming as some of the activities through 5G networks to be very or extremely appealing, which contributes to data usage.
Several apps account for considerable smartphone reach across audiences, with YouTube accounting for about 74% audience reach, followed by 61% for Gmail, 59% for Facebook, and 58% for the Google Search app. The extensive reach of such smartphone apps, despite the Android and iOS division among the audience, signifies deep app penetration and usage in the United States. This highlights the need for data storage to provide the required memory platforms for such media to perform and store user data, thereby creating a greater demand for data processing facilities.
Smartphone adoption and increasing 5G connections to drive market growth
The United States is a significant market in both North America and the global smartphone portfolio. With smartphone adoption expected to grow from 83% in 2021 to 85% by 2025, it will substantially contribute to the growth of subscriber penetration rates, increasing from 85% in 2021 to 86% by 2025. This growth will result in a rise in smartphone sales and the overall number of smartphones in the country. Although longer replacement rates and a lack of compelling features in the US smartphone industry led to a decrease in sales in 2018, the market received a major boost with the 5G rollout and adoption by operators in the highly competitive smartphone market.
Additionally, data released in January 2022 indicated a USD 1.7 billion increase in smartphone sales value, totaling approximately USD 74.7 billion in 2022, compared to about USD 73 billion in 2021. Despite the market slowdown during COVID-19, 5G has been a key driver of smartphone adoption and penetration in the United States. The pandemic increased the anticipated number of 5G connections in 2025 from 205 million to about 218 million, signifying how 5G would drive better smartphone sales in the region.
The increase in the number of smartphones was observed through the growth of mobile wireless subscriber connections in the country, rising from about 442.5 million in 2019 to approximately 498.91 million by 2021. This trend indicates the high penetration rates contributing to sales. Over the forecast period, 5G will heavily contribute to data generation through increased data points, generating demand for more data centers to store and process the data.
United States Data Center Industry Overview
The United States Data Center Market is fragmented, with the top five companies occupying 16.24%. The major players in this market are CoreSite (America Tower Corporation), Databank Holdings Ltd, Digital Realty Trust, Inc., Equinix, Inc. and NTT Ltd. (sorted alphabetically).
Additional Benefits:
The market estimate (ME) sheet in Excel format
3 months of analyst support
TABLE OF CONTENTS
1 EXECUTIVE SUMMARY & KEY FINDINGS
2 REPORT OFFERS
3 INTRODUCTION
3.1 Study Assumptions & Market Definition
3.2 Scope of the Study
3.3 Research Methodology
4 MARKET OUTLOOK
4.1 It Load Capacity
4.2 Raised Floor Space
4.3 Colocation Revenue
4.4 Installed Racks
4.5 Rack Space Utilization
4.6 Submarine Cable
5 Key Industry Trends
5.1 Smartphone Users
5.2 Data Traffic Per Smartphone
5.3 Mobile Data Speed
5.4 Broadband Data Speed
5.5 Fiber Connectivity Network
5.6 Regulatory Framework
5.6.1 United States
5.7 Value Chain & Distribution Channel Analysis
6 MARKET SEGMENTATION (INCLUDES MARKET SIZE IN VOLUME, FORECASTS UP TO 2030 AND ANALYSIS OF GROWTH PROSPECTS)
6.1 Hotspot
6.1.1 Atlanta
6.1.2 Austin
6.1.3 Boston
6.1.4 Chicago
6.1.5 Dallas
6.1.6 Houston
6.1.7 Los Angeles
6.1.8 New Jersey
6.1.9 New York
6.1.10 Northern California
6.1.11 Northern Virginia
6.1.12 Northwest
6.1.13 Phoenix
6.1.14 Salt Lake City
6.1.15 Rest of United States
6.2 Data Center Size
6.2.1 Large
6.2.2 Massive
6.2.3 Medium
6.2.4 Mega
6.2.5 Small
6.3 Tier Type
6.3.1 Tier 1 and 2
6.3.2 Tier 3
6.3.3 Tier 4
6.4 Absorption
6.4.1 Non-Utilized
6.4.2 Utilized
6.4.2.1 By Colocation Type
6.4.2.1.1 Hyperscale
6.4.2.1.2 Retail
6.4.2.1.3 Wholesale
6.4.2.2 By End User
6.4.2.2.1 BFSI
6.4.2.2.2 Cloud
6.4.2.2.3 E-Commerce
6.4.2.2.4 Government
6.4.2.2.5 Manufacturing
6.4.2.2.6 Media & Entertainment
6.4.2.2.7 Telecom
6.4.2.2.8 Other End User
7 COMPETITIVE LANDSCAPE
7.1 Market Share Analysis
7.2 Company Landscape
7.3 Company Profiles (includes Global Level Overview, Market Level Overview, Core Business Segments, Financials, Headcount, Key Information, Market Rank, Market Share, Products and Services, and Analysis of Recent Developments).