유채 기름의 전 세계 생산량은 2021/2022년 2,907만 톤에서 2022/2023년에는 3,180만 톤으로 증가했습니다.
2022/2023년 해바라기유의 세계 생산량은 2,036만 톤으로 2021/2022년 1,984만 톤에서 증가했습니다.
면실유의 세계 생산량은 2022/2023년에는 502만톤으로 2021/2022년 497만톤에서 증가했습니다.
그러나 유럽과 남미의 주요 생산국을 포함한 여러 국가에서 가뭄이 증가했기 때문에 올리브 오일 생산량이 감소했습니다. 2022/2023년 올리브 오일의 세계 생산량은 282만 톤으로 2021/2022년 327만 톤에 비해 감소했습니다.
따라서 식용유지에서의 생산량 증가와 활성 표백토 수요의 급증은 세계 시장에 성장 기회를 가져올 것으로 예상됩니다.
아시아태평양이 시장을 독점
아시아태평양은 활성 표백토 시장에서 가장 큰 점유율을 차지할 것으로 예상됩니다. 아시아태평양의 식물성 기름 소비량과 생산량은 중국이 가장 큰 점유율을 차지합니다. 생산량은 많지만 소비량이 생산량을 상회하고 있기 때문에 수출량에 비해 수입량이 많아지고 있습니다.
Oils &Fats International에 따르면 2021-2022년 중국의 식용유 생산량은 2,800만 톤으로 전년의 2,815만 톤에서 15만 톤 감소했습니다.
중국 정부의 보고에 의하면, 2022년 7월의 동국에의 팜유와 대두유의 수입량은 각각 전년도의 370만 톤, 63만 톤에 비해 30만 톤, 17만 톤 감소했습니다.
인도 식물성 기름 생산자 협회(IVPA)에 따르면, 2022년 10월-2023년 9월, 인도는 약 1,437만 톤의 식물성 기름를 수입했습니다.
국제에너지기구(IEA)에 따르면, 한국에서는 총 에너지 공급량에 있어서 석유가 가장 중요한 에너지원으로 계속되고 있습니다.
또한 캐나다 농업·농업·식품성(AAFC)의 보고서에 의하면, 동국에 있어서의 식용유의 소매 총 매출액은 2021년에 4억 7,870만 달러에 달했습니다. 상고는 2026년까지 5,223억 달러에 달할 것으로 예측되고 있습니다.
총무성에 의하면, 식물성 기름의 소매 가격은 2021년 3월-2023년 1월에 걸쳐 67% 상승해, 다른 대부분의 주식의 가격 상승을 훨씬 웃돌았습니다.
게다가 국내 대두 수입액은 2023년 6월의 1억 9,005만 달러에서 2023년 7월에는 2억 1,398만 달러에 이르렀습니다.
따라서, 상기의 이유에 의해 예측 기간 중은 아시아태평양이 시장을 독점할 것으로 예상됩니다.
활성 표백토 산업 개요
활성 표백토 시장은 그 특성상 단편화되어 있습니다.
기타 혜택
엑셀 형식 시장 예측(ME) 시트
3개월간의 애널리스트 서포트
목차
제1장 서론
조사의 전제조건
조사 범위
제2장 조사 방법
제3장 주요 요약
제4장 시장 역학
성장 촉진요인
식용유 수요 증가
성장 억제요인
대체 제품과 대체 기술의 존재
산업 밸류체인 분석
Porter's Five Forces 분석
공급기업의 협상력
소비자의 협상력
신규 참가업체의 위협
대체품의 위협
경쟁도
제5장 시장 세분화
용도별
식용유 및 지방
미네랄 오일 및 윤활유
기타(화학, 바이오디젤 등)
지역별
아시아태평양
중국
인도
일본
한국
기타 아시아태평양
북미
미국
캐나다
멕시코
유럽
독일
영국
이탈리아
프랑스
기타 유럽
남미
브라질
아르헨티나
기타 남미
중동 및 아프리카
사우디아라비아
남아프리카
기타 중동 및 아프리카
제6장 경쟁 구도
M&A, 합작사업, 제휴, 협정
시장 랭킹 분석
주요 기업의 전략
기업 프로파일
Ashapura Perfoclay Limited(APL)
Clariant
Global Bleach Chem Pvt. Ltd
Hrp Industries
Indian Clay And Mineral Co.
Musim Mas Holdings Pte Ltd
Oil-dri Corporation of America
Phoenix Chemicals(Pvt.) Ltd
Refoil Earth Pvt. Ltd
Shell Plc(ecooils Limited)
Taiko Group of Companies(Taiko Bleaching Earth Sdn. Bhd.)
The W Clay Industries Sdn Bhd
제7장 시장 기회와 앞으로의 동향
바이오디젤 생산 증가
KTH
영문 목차
영문목차
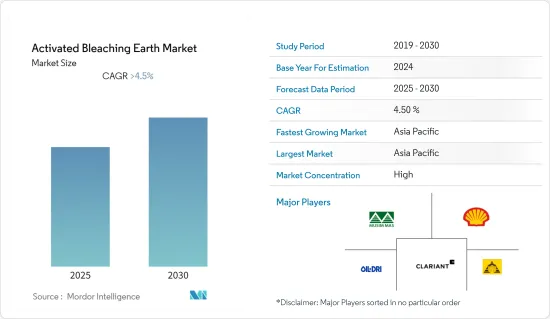
The Activated Bleaching Earth Market is expected to register a CAGR of greater than 4.5% during the forecast period.
COVID-19 had a negative impact on the activated bleaching earth sector. Global lockdowns and severe rules enforced by governments resulted in a catastrophic setback as most production hubs were shut down. Nonetheless, the business has been recovering since 2021 and is expected to rise significantly in the coming years.
Key Highlights
The major factor driving the market growth is the growing demand for edible oils.
However, the presence of alternative products and technologies is hindering the market growth.
Increasing production of bio-diesel is expected to provide lucrative growth opportunities to the market players in the coming years.
The Asia-Pacific region dominates the global market, with the largest consumption from countries such as China, India, and Japan.
Activated Bleaching Earth Market Trends
Increasing Demand for Edible Oil & Fats
Activated bleaching earth is used to purify edible oils, used cooking oil (UCO), sludge oils, acid oils, and other waste oils that are utilized in the manufacture of biodiesel and renewable diesel. It is widely used in the refining, decolorizing, and bleaching of edible oil and fats.
Activated bleaching earths have a higher ability to absorb impurities in comparison to natural bleaching earths.
It is used for the purification of various edible oils and fats, including soya bean oil, cotton seed oil, palm oil, rapeseed oil, sunflower oil, safflower oil, rice bran oil, corn oil, canola oil, olive oil, and sesame oil.
In 2022/23, the global production volume of palm oil stood at 77.22 million metric tons, up from 73.83 million metric tons in 2021/22.
In 2022/23, the global production volume of soybean oil increased by 3.0% to 61,494 thousand metric tons, up from 59,259 thousand metric tons in 2021/22.
The global production of rapeseed oil across the world increased to 31.8 million metric tons in 2022/23, up from 29.07 million metric tons in 2021/22.
In 2022/23, the global production of sunflower seed oil stood at 20.36 million metric tons, up from 19.84 million metric tons in 2021/22.
The global production of cottonseed oil stood at 5.02 million metric tons in 2022/23, up from 4.97 million metric tons in 2021/22.
However, the world witnessed a decline in the production of olive oil owing to the rising drought conditions in several countries, including major producers in Europe and South America. In 2022/23, the global production of olive oil stood at 2.82 million metric tons, which is lower in comparison to 3.27 million metric tons in 2021/22
Thus, the increase in production and surge in demand for activated bleaching earth in edible fats and oils are expected to provide growth opportunities in the global market.
Asia-Pacific Region to Dominate the Market
The Asia-Pacific region is expected to account for the largest share of the activated bleaching earth market. China holds the largest share of vegetable oil consumption and production in Asia-Pacific. Though the production volume is high, consumption exceeds production, resulting in higher import volumes when compared to export volumes.
According to Oils & Fats International, during the crop year 2021-22, China produced 28 million tonnes of edible oil, a 150,000 tonnes decrease from the previous year's volume of 28.15 million tonnes. The decrease in the production volume is due to the drop in the oilseed imports, leading to a downgrade in edible vegetable oil production.
As per the reports by the Government of China, in July 2022, the palm oil and soyabean oil imports to the country declined by 300,000 tonnes and 170,000 tonnes as compared to their previous year's volume of 3.7 million tonnes and 630,000 tonnes, respectively.
According to the Indian Vegetable Oil Producers' Association (IVPA), during the current oil year (October 2022-September 2023), India imported around 14.37 million tonnes of vegetable oil, as compared to 14.07 million tonnes imported in the previous year.
According to the International Energy Agency (IEA), oil continues to be the most important energy source in South Korea in terms of total energy supply. South Korea has a very important refining industry and is self-sufficient in most products other than petrochemical feedstocks.
Furthermore, according to a report by Agriculture and Agri-Food Canada (AAFC), the total retail sales of cooking oils in the country were valued at USD 478.7 million in 2021. The sales of cooking oil are projected to reach USD 522.3 billion by the year 2026. While edible oil consumption is expected to reach nearly one million metric tons by 2026.
According to the Ministry of Internal Affairs and Communications, the retail price for vegetable oil grew by 67% from March 2021 to January 2023, far above the price increase for most other staple foods.
Additionally, the import value of soybeans in the country reached USD 213.98 million in July 2023 from USD 190.05 million in June 2023. The soybean oil exports in the country accounted for USD 0.17 million, whereas imports accounted for USD 2.43 million, resulting in a negative trade balance.
Hence, due to the above-mentioned reasons, Asia-Pacific is anticipated to dominate the market during the forecast period.
Activated Bleaching Earth Industry Overview
The activated bleaching earth market is fragmented in nature. Some of the major players in the market (not in any particular order) include Clariant, Musim Mas, Shell, Oil-Dri Corporation of America, and Ashapura Perfoclay Limited, among other companies.
Additional Benefits:
The market estimate (ME) sheet in Excel format
3 months of analyst support
TABLE OF CONTENTS
1 INTRODUCTION
1.1 Study Assumptions
1.2 Scope of the Study
2 RESEARCH METHODOLOGY
3 EXECUTIVE SUMMARY
4 MARKET DYNAMICS
4.1 Drivers
4.1.1 Growing Demand for Edible Oils
4.2 Restraints
4.2.1 Presence of Alternative Products and Technologies
4.3 Industry Value Chain Analysis
4.4 Porter's Five Forces Analysis
4.4.1 Bargaining Power of Suppliers
4.4.2 Bargaining Power of Consumers
4.4.3 Threat of New Entrants
4.4.4 Threat of Substitute Products and Services
4.4.5 Degree of Competition
5 MARKET SEGMENTATION (Market Size in Value)
5.1 Application
5.1.1 Edible Oil and Fats
5.1.2 Mineral Oil and Lubricants
5.1.3 Other Applications (Chemical, Biodiesel, etc.)
5.2 Geography
5.2.1 Asia-Pacific
5.2.1.1 China
5.2.1.2 India
5.2.1.3 Japan
5.2.1.4 South Korea
5.2.1.5 Rest of Asia-Pacific
5.2.2 North America
5.2.2.1 United States
5.2.2.2 Canada
5.2.2.3 Mexico
5.2.3 Europe
5.2.3.1 Germany
5.2.3.2 United Kingdom
5.2.3.3 Italy
5.2.3.4 France
5.2.3.5 Rest of Europe
5.2.4 South America
5.2.4.1 Brazil
5.2.4.2 Argentina
5.2.4.3 Rest of South America
5.2.5 Middle East and Africa
5.2.5.1 Saudi Arabia
5.2.5.2 South Africa
5.2.5.3 Rest of Middle East and Africa
6 COMPETITIVE LANDSCAPE
6.1 Mergers and Acquisitions, Joint Ventures, Collaborations, and Agreements
6.2 Market Ranking Analysis
6.3 Strategies Adopted by Leading Players
6.4 Company Profiles
6.4.1 Ashapura Perfoclay Limited (APL)
6.4.2 Clariant
6.4.3 Global Bleach Chem Pvt. Ltd
6.4.4 Hrp Industries
6.4.5 Indian Clay And Mineral Co.
6.4.6 Musim Mas Holdings Pte Ltd
6.4.7 Oil-dri Corporation of America
6.4.8 Phoenix Chemicals (Pvt.) Ltd
6.4.9 Refoil Earth Pvt. Ltd
6.4.10 Shell Plc (ecooils Limited)
6.4.11 Taiko Group of Companies (Taiko Bleaching Earth Sdn. Bhd.)