


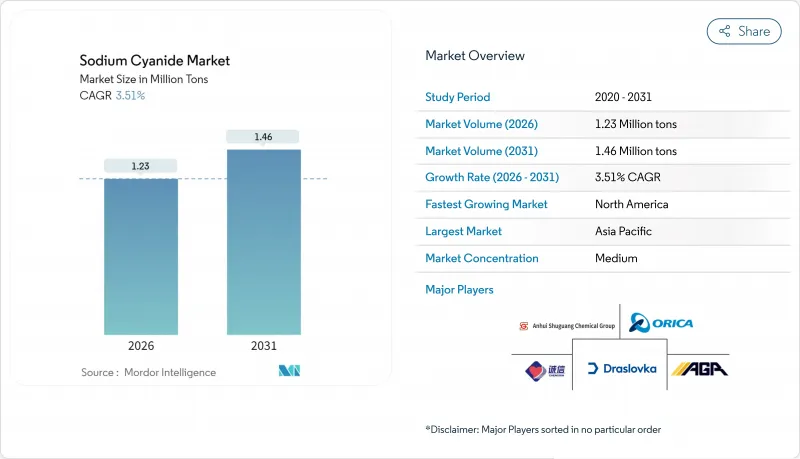
세계의 시안화나트륨 시장은 2025년 119만톤에서 2026년 123만톤으로 성장하고, 2026년부터 2031년까지 CAGR 3.51%로 성장을 지속하여 2031년까지 146만톤에 달할 것으로 예측되고 있습니다.
전통적인 금광산 지역에서의 성숙한 수요는 저품위 광석 프로젝트, 엄격화하는 환경 규제, 물류 리스크를 저감하는 모듈식 현지 생산 기술에 의한 새로운 추진력과 공존하고 있습니다. 북미 및 아시아태평양의 사업자는 원격지의 힙 리치 현장용으로 고형 브리켓에 조달 조정을 계속하는 한편, 저스트 인 타임 납품에 의한 재고 비용 절감을 도모하는 자동화 제련소에서는 액체 용액이 지지를 모으고 있습니다. 시장 리더 기업은 생산 능력과 지역 전개를 확대하는 인수를 통해 수직 통합을 강화하고, 조사 파이프라인은 대체 침출제를 파일럿 규모에서 상업적 실현 가능성으로 추진하고 있습니다. 이러한 요인이 함께 규제 감시나 화물 프리미엄이 수량 성장에 억제요인이 되는 중에서도, 시안화나트륨 시장의 장기적인 중요성을 뒷받침하고 있습니다.
Nevada Gold Mines 와 Newmont의 타나미 광구와 같은 주요 광산에서 광석 품위의 저하에 의해 현재는 기존 대비 30-40% 증가한 시안화물 첨가가 필요하며, 이 변화는 금 생산량이 유지됨에도 불구하고 평균 시약 사용량을 밀어 올리는 요인이 되고 있습니다. 현대의 힙 리치 패드는 1g/t Au 미만의 광석을 처리하고 체류 시간을 연장함으로써 경제적인 회수율을 확보하고 있습니다. 원광 품위의 감소는 시안화 나트륨 소비량에 비례하지 않는 증가를 초래합니다. 비슷한 경향은 서아프리카의 산화광대와 시베리아의 불용성 광맥에서도 볼 수 있으며, 신규 광상 발견이 둔화되는 가운데 안정된 톤수 수요를 창출하고 있습니다. 엔지니어링 팀은 pH, 산소농도, 고체-액체 비율 최적화를 계속하고 있지만, 화학적 원리상 금 용해속도는 여전히 시안화나트륨 농도와 밀접한 관련이 있습니다. 이러한 현실이 결합되어 세계의 시안화나트륨 시장은 순환적인 것이 아니라 구조적인 수요를 뒷받침하고 있습니다.
카자흐스탄의 RG Gold 회로에서 Nordgold의 Bissa-Bouly 복합 시설에 이르기까지, 탐사되지 않은 지역의 개발 사업자는 안정적인 시안화 나트륨 투여에 의존하는 힙 리치 플로우시트를 표준화하고 있습니다. 많은 광상에는 시안화물 침출에서 쉽게 용해되는 산화광석이 포함되어 있어 단기간에 저자본으로 건설을 가능하게 합니다. 중앙아시아 전역에서 철도 회랑과 드라이 포트가 개통됨에 따라 지역의 NaCN 생산자에 대한 접근이 개선되고, 운임할증이 줄어들고 마진이 강화되고 있습니다. 기관 투자자는 현재 대출 조건으로 국제 시안화물 관리 코드(ICMC) 준수를 요구하고 있으며, 사업자는 코드 인증 제품을 공급할 수 있는 공급업체와 급 계약을 체결할 수밖에 없습니다. 그 결과 카자흐스탄, 우즈베키스탄, 사헬 지역에 유통 거점을 가진 시안화나트륨 시장 진출 기업은 향후 10년간 증가하는 공급량의 과반수를 획득할 전망입니다.
ICMC 감사기관은 2024년 시안화물의 운송, 저장 및 소비에 관한 실시간 텔레메트리를 의무화함으로써 기준을 끌어올려 중견 광산 기업의 연간 컴플라이언스 예산을 15-25% 증가시켰습니다. 영국에서 발생한 주목도가 높은 누출 사고(90kg의 어류 사멸을 일으켰습니다)는 대중의 감시를 강화해, 시안화물 취급업자의 보험료 상승을 초래했습니다. 유럽연합(EU)과 미국 노동안전보건국(OSHA)에 의한 엄격한 공기중 시안화수소(HCN) 규제는 밀폐형 처리 시스템과 개인보호구(PPE)의 업그레이드를 의무화했습니다. 이러한 요인이 함께, 특히 자금이 한정되어 있는 중소 광산 기업에 있어서 생산량의 성장이 억제될 전망입니다.
2025년 출하량 중 고체 시안화나트륨이 60.72%를 차지했습니다. 이 지위는 동일한 형태의 유출 위험, 장기 보존성 및 ICMC 문서화의 단순화에 의해 지원됩니다(ORICA.COM). 대규모 힙 리치 조업에서는 연탄을 사용하여 용해를 단계적으로 제어하고 60-90일 도달주기에서 시안화물 농도 프로파일을 조정합니다. 고체 제품 취급은 엄격한 관리 체인 프로토콜을 따르는 ISO 탱크를 통한 벌크 운송과 1톤 IBC 컨테이너를 통한 배송도 가능합니다.
한편, 액체 하위 부문은 CAGR 3.72%로 성장을 지속하여, 2031년까지 58만 3,000톤에 육박할 전망입니다. 패키징과 마이크로 물류 분야에서 경쟁이 치열해짐에 따라 서비스 차별화는 단순한 톤수에서 엔드 투 엔드 안전성, 원격 측정 및 시약 관리로 전환하고 있습니다. 30-32% 용액으로 공급되는 액체는 '밀크 런' 물류와 조화되어 운전자금 개선과 정밀한 화학약품 공급 비율을 실현합니다. 이러한 동향이 결합되어 고체 부문의 우위를 유지하면서 액체 부문을 성장의 초점으로 부상시켜 시안화나트륨 시장의 2형 구조를 강화하고 있습니다.
본 시안화나트륨 보고서는 제품 형태(고체 및 액체 용액), 최종 사용 산업(광업, 화학, 기타 최종 사용 산업), 지역(아시아태평양, 북미, 유럽, 남미, 중동, 아프리카)별로 분석했습니다. 시장 예측은 수량(톤) 단위로 제시됩니다.
아시아태평양은 2025년 29.95%의 수익 점유율을 차지했으며 중국 허베이성 시안화물 합성 공원, 호주 세계 금광산, 인도네시아 신흥 힙 프로젝트를 배경으로 했습니다. 그러나 환경규제의 강화와 대체 침출제의 시험 조업에 의해 신규 수요가 억제되어 지역 성장률은 3%대 중반으로 둔화될 것으로 전망됩니다. 한편 북미 시안화 나트륨 시장은 Nevada Gold Mines의 합작 사업, 아비티비 녹암대에서의 탐사 재개, 멕시코의 모듈식 현지 합성 능력 증강을 배경으로 3.98%의 연평균 복합 성장률(CAGR)을 보일 것으로 예측됩니다. 남미에서는 페루와 칠레에서 광미 재처리 프로젝트의 진행이 지역 시약 수요를 끌어올리는 한편 중앙아시아에서는 카자흐스탄과 우즈베키스탄이 새로운 산화광 개발을 시작함으로써 소규모이면서 생산량이 증가하고 있습니다. 유럽은 안정적이고 소규모 소비 지역이며 독일과 프랑스의 산업 사용자가 소비의 대부분을 차지합니다. 중동 및 아프리카는 함께 소규모 점유율이지만, 신규 광상과 인프라 정비가 교차하는 지역에서는 현저한 성장이 전망됩니다.
The Sodium Cyanide market is expected to grow from 1.19 Million tons in 2025 to 1.23 Million tons in 2026 and is forecast to reach 1.46 Million tons by 2031 at 3.51% CAGR over 2026-2031.

Mature demand in traditional gold-mining jurisdictions co-exists with fresh momentum from low-grade ore projects, tighter environmental codes, and modular on-site production technologies that lower logistics risk. Operators in North America and Asia-Pacific continue to recalibrate procurement toward solid briquettes for remote heap-leach sites, while liquid solutions gain favor at automated mills where just-in-time delivery trims inventory costs. Market leaders strengthen vertical integration through acquisitions that expand capacity and regional reach, and research pipelines push alternative lixiviants from pilot scale toward commercial feasibility. Collectively, these forces reinforce the sodium cyanide market's long-term relevance even as regulatory scrutiny and freight premiums apply counterweights to volume growth.
Declining ore grades at flagship operations such as Nevada Gold Mines and Newmont's Tanami asset now demand cyanide additions that are 30-40% above historical norms, a shift that lifts average reagent intensity even where gold output stays flat. Modern heap-leach pads handle ore below 1 g/t Au, using extended residence times to secure economic recoveries, and every incremental percentage point drop in head grade translates into a disproportionate rise in sodium cyanide consumption. Similar patterns play out in West African oxide belts and Siberia's refractory lodes, adding steady tonnage demand even as greenfield discoveries slow. Engineering teams continue to optimize pH, oxygen levels, and solid-liquid ratios, yet chemistry fundamentals still tether gold dissolution rates to cyanide concentration. These realities together underpin a structural, not cyclical, pull on the global sodium cyanide market.
From Kazakhstan's RG Gold circuit to Nordgold's Bissa-Bouly complex, developers in under-explored regions are standardizing heap-leach flowsheets that rely on consistent sodium cyanide dosing. Many deposits host oxidized ores that dissolve readily under cyanide leach, enabling capital-lite builds over short schedules. Proximity to regional NaCN producers is improving as rail corridors and dry ports open across Central Asia, trimming freight surcharges and strengthening margins. Institutional lenders now require International Cyanide Management Code (ICMC) compliance as a condition of finance, pushing operators to lock in supply contracts with vendors capable of delivering code-certified product. Consequently, sodium cyanide market participants with distribution hubs in Kazakhstan, Uzbekistan, and the Sahel stand to capture an outsized share of incremental volumes over the decade.
ICMC auditors raised the bar in 2024 by mandating real-time telemetry on cyanide transport, storage, and consumption, adding 15-25% to annual compliance budgets for mid-tier miners. A high-profile spill in the United Kingdom that resulted in 90 kg of fish mortality sharpened public scrutiny and triggered insurance premium hikes for cyanide handlers. Stringent European Union and U.S. Occupational Safety and Health Administration (OSHA) limits on airborne HCN now compel enclosed handling systems and personal protective equipment upgrades. These factors collectively temper volume growth, especially for junior miners with constrained capital.
Other drivers and restraints analyzed in the detailed report include:
For complete list of drivers and restraints, kindly check the Table Of Contents.
Solid sodium cyanide accounted for 60.72% of 2025 shipments, a position underpinned by the format's lower spill risk, longer shelf life, and simplified ICMC documentation ORICA.COM. Large heap-leach operations use briquettes to stage-gate dissolution, thereby regulating the cyanide concentration profile over 60-90 day leach cycles. Solid product handling also permits bulk ISO-tank or 1 ton IBC deliveries, aligning with strict chain-of-custody protocols.
Conversely, the liquids sub-segment is poised for 3.72% CAGR, closing in on 583,000 t by 2031. Competitive intensity intensifies around packaging and micro-logistics, with service differentiation shifting from mere tonnage to end-to-end safety, telemetry, and reagent stewardship. Delivered as 30-32% solution, liquids sync with "milk-run" logistics, improving working capital and enabling precise chem-feed ratios. Together these trends preserve the solid segment's command while elevating liquids as the growth spotlight, reinforcing the sodium cyanide market's dual-format architecture.
The Sodium Cyanide Report is Segmented by Product Form (Solid and Liquid Solution), End-User Industry (Mining, Chemicals, and Other End-User Industries), and Geography (Asia-Pacific, North America, Europe, South America, and Middle-East and Africa). The Market Forecasts are Provided in Terms of Volume (Tons).
Asia-Pacific held 29.95% revenue share in 2025 on the strength of China's cyanide synthesis park in Hebei, Australia's world-class gold camps, and Indonesia's emergent heap projects. However, regional growth cools to a mid-3% pace as tighter environmental norms and alternative lixiviant pilots moderate fresh demand. Conversely, North America's sodium cyanide market is expected to post 3.98% CAGR, underwritten by the Nevada Gold Mines joint venture, renewed exploration in the Abitibi greenstone belt, and modular on-site synth capacity adds in Mexico. South America's pipeline of tailings re-treatments in Peru and Chile nudges regional reagent needs upward, while Central Asian tonnage climbs off a small base as Kazakhstan and Uzbekistan open new oxide developments. Europe remains a steady yet small consumer, with industrial users in Germany and France dominating offtake. Africa and the Middle East together account for a modest share but deliver outsized growth where greenfield deposits intersect infrastructure upgrades.