ㅁ Add-on 가능: 고객의 요청에 따라 일정한 범위 내에서 Customization이 가능합니다. 자세한 사항은 문의해 주시기 바랍니다.
ㅁ 보고서에 따라 최신 정보로 업데이트하여 보내드립니다. 배송기일은 문의해 주시기 바랍니다.
한글목차
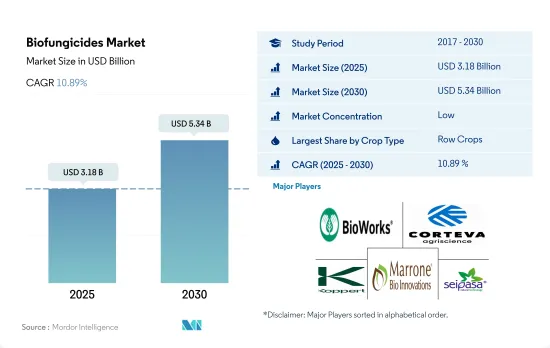
바이오 살균제 시장 규모는 2025년에 31억 8,000만 달러에 달할 것으로 추정됩니다. 2030년에는 53억 4,000만 달러에 이를 것으로 예상되고, 예측 기간(2025-2030년)의 CAGR은 10.89%를 나타낼 것으로 전망됩니다.
2022년 세계의 바이오 살균제 시장은 주로 연작 작물의 생산이 견인했으며, 주요 작물은 보리, 옥수수, 밀, 유채, 호밀, 해바라기, 콩, 쌀이었습니다. 이 작물은 금액 기준으로 세계 바이오 살균제 시장의 약 84.1%를 차지합니다. 북미가 이 분야 시장을 독점하고 있으며, 미국이 시장 전체의 71.4%를 차지하는 주요 국가입니다. 미국에서는 연작 작물의 재배 면적이 상당히 넓기 때문에 연작 작물에서의 바이오 살균제의 소비는 앞으로도 성장할 것으로 예상됩니다.
바나나, 사과, 포도, 토마토, 양파, 오이, 양배추 등의 과일 및 채소를 포함한 원예 작물은 2022년 세계 바이오 살균제 시장의 12.3%를 차지했습니다. 유럽은 이 시장의 하위 부문을 지배하고 있으며 68.4%의 점유율을 차지하고 있습니다. 이탈리아, 프랑스, 스페인이 이 지역의 주요 국가이며 이탈리아는 39.7%의 점유율을 차지하고 있습니다.
커피, 차, 코코아, 면화, 담배, 고무, 사탕수수 등의 환금 작물은 2022년 바이오 살균제의 세계 총 소비량의 4.0%를 차지했습니다. 유럽은 이 시장의 하위 부문을 지배하며 42.1%의 점유율을 차지합니다. 프랑스, 독일, 이탈리아가 이 지역의 주요 국가이며 프랑스는 34.2%의 점유율을 차지하고 있습니다.
건강상 우려로 유기적으로 생산된 과일 및 채소에 대한 수요가 증가하고 있으며, 2023년부터 2029년까지 시장의 작물 부문에서 바이오 살균제의 소비를 더욱 밀어올릴 것으로 예상됩니다.
농업에서는 바실러스균, 트리코델마균, 스트렙토마이세스균, 슈도모나스균이 바이오 살균제로서 가장 일반적으로 이용되고 있는 미생물입니다. 이들 미생물은 피슘균, 리조쿠토니아균, 푸사리움균, 스클레로티니아균, 티에라비옵시스균, 보틀리티스균, 우동병 등의 병원균에 효과가 있는 것이 증명되고 있습니다.
유럽은 바이오 살균제의 최대 시장으로, 2022년에는 금액 기준으로 41.1%의 점유율을 차지했습니다. 프랑스는 유럽 연합의 주요 농업 생산국입니다. 밀, 호밀, 보리, 옥수수, 사탕무, 귀리가 이 나라에서 재배되는 주요 작물 중 하나입니다. 프랑스는 2022년 금액 기준으로 유럽 바이오 살균제 시장의 27.5% 점유율을 차지했습니다. 이 높은 점유율은 주로 이 나라의 유기 재배 면적이 광대하기 때문이며, 2022년에는 이 지역의 유기 재배 면적 전체의 17.4%를 차지했습니다.
북미는 바이오 살균제의 2위 소비국으로 2022년에는 8억 2,680만 달러로 37.7%의 점유율을 차지했고, 2029년에는 17억 6,000만 달러에 이를 것으로 예상됩니다. 미국과 같은 북미 국가에서는 유기 증명서 비용 점유 프로그램, 비용 점유 완충 지대를 설치하기위한 자금 지원, 유기 농가에 대한 저이자금 대출 등 정부의 이니셔티브이 바이오 살균제의 사용을 가속화하고 있습니다. 바이오 살균제 시장은 2023년부터 2029년까지 11.5%의 연평균 복합 성장률(CAGR)을 나타낼 것으로 예측됩니다.
생물학적 방제와 식물 성장 촉진 모두에서 여러 작용 방식과 소수의 바이오 살균제가 수행하는 역할은 바이오 살균제 시장을 세계적으로 견인할 것으로 예상됩니다. 시장은 2023년부터 2029년에 걸쳐 CAGR 10.8%를 나타낼 것으로 추정됩니다.
세계의 바이오 살균제 시장 동향
북미와 유럽에서는 유기농업에 대한 의식이 높아지고 정부의 이니셔티브으로 유기농업의 생산량이 과거 최고를 기록하고 있습니다.
유기농업은 지속가능한 식량시스템에 크게 공헌하는 것으로 대두되어 세계 187개국에서 실천되고 있습니다. 2021년 기준 세계 유기농지역은 7,230만 ha로 2018년부터 2021년까지 전 지역에서 평균 2.9% 증가했습니다. 유기농경지는 1,440만 ha로, 유기농지 전체의 19.9%를 차지하고 있습니다.
유기농업의 가장 강력한 시장은 북미와 유럽으로 세계 유기농 경지의 41.0%를 차지하고 있습니다. 2022년에는 유럽에는 650만ha의 유기 경작지가 있었으며, 이는 유기 경작지 전체의 44.1%에 해당했습니다. 북미와 유럽에서 유기 재배되는 가장 중요한 작물은 사과, 딸기, 곡물, 올리브입니다.
아시아태평양의 신흥 국가들은 또한 유기농업운동에 참여하며 국내 수요를 충족하는 신선한 유기농산물의 생산과 공급으로 자급자족하고 있습니다. 유기농업의 동향은 아시아태평양에서 기세를 늘리고 있으며, 이 지역에서는 2017년부터 2022년에 걸쳐 유기경지면적이 18.8% 증가했습니다. 이 지역 정부의 주요 이니셔티브도 유기농 농업의 확대 경향에 중요한 역할을 합니다. 예를 들어 일본의 식량·농업·농촌 기본계획은 2030년까지 유기농가와 유기농지의 수를 3배로 늘리는 것을 목표로 하고 있습니다.
유기농업의 성장의 원동력이 되는 것은 토양의 건강을 촉진하고, 환경에 대한 영향을 줄이고, 보다 건강한 식품을 생산하는 등 유기농업의 이점에 대한 의식 증가입니다.
유기농 식품의 1인당 지출은 주로 미국과 독일에서 관찰되지만, 이는 보다 건강하고 지속 가능한 식품에 대한 소비자 수요에 기인합니다.
유기농 식품 시장은 지난 몇 년간 현저한 성장을 거두었으며, 세계 매출은 2012년 708억 달러에서 2020년 1,206억 달러에 이르렀습니다. 유기농 식품에 대한 추세는 보다 건강하고 지속가능한 식품 선택을 추구하는 소비자 수요 증가와 전통적인 농업이 환경에 미치는 영향에 대한 의식이 증가하는 등 여러 요인들에 힘입어지고 있습니다. 세계 유기농 식품 시장은 향후 수년간 성장세가 지속될 것으로 예상됩니다.
유기농 무역협회가 2021년에 실시한 조사에 따르면 같은 해 유기농 과일 및 채소 매출은 약 4.5% 증가하여 전체 유기농 매출의 15%를 차지했습니다. 유기농 제품에 대한 평균 지출액은 북미가 시장을 독점하고 있으며, 미국 1인당 지출액은 2021년에 186.7달러에 이르렀고, 북미 국가 중 가장 높았습니다. 유럽도 유기농 식품 시장에서 큰 성장이 예상되고 있으며, 2021년 1인당 지출액이 가장 높은 것은 독일에서 75.6달러였습니다.
유기농 식품 시장은 소비자의 가처분 소득이 높은 선진국들이 여전히 지배적이지만, 신흥 국가에서도 성장이 예상됩니다. 예를 들어, 아시아태평양에서는 근로자 계급이 증가하고 있으며 유기농 식품을 얻기 쉽고 저렴한 가격으로 시장 확대에 기여할 수 있습니다.
바이오 살균제 산업 개요
바이오 살균제 시장은 단편화되어 상위 5개사에서 1.40%를 차지하고 있습니다. 이 시장 주요 기업은 다음과 같습니다. Bioworks Inc., Corteva Agriscience, Koppert Biological Systems Inc., Marrone Bio Innovations Inc. and Seipasa SA(알파벳순 정렬).
기타 혜택
엑셀 형식 시장 예측(ME) 시트
3개월의 애널리스트 서포트
목차
제1장 주요 요약과 주요 조사 결과
제2장 보고서 제안
제3장 소개
조사의 전제조건과 시장 정의
조사 범위
조사 방법
제4장 주요 산업 동향
유기 재배 면적
1인당 유기농 제품에 대한 지출
규제 프레임워크
아르헨티나
호주
브라질
캐나다
중국
이집트
프랑스
독일
인도
인도네시아
이탈리아
일본
멕시코
네덜란드
나이지리아
필리핀
러시아
남아프리카
스페인
태국
터키
영국
미국
베트남
밸류체인과 유통채널 분석
제5장 시장 세분화
작물 유형
환금 작물
원예 작물
경작 작물
지역
아프리카
국가별
이집트
나이지리아
남아프리카
기타 아프리카
아시아태평양
국가별
호주
중국
인도
인도네시아
일본
필리핀
태국
베트남
기타 아시아태평양
유럽
국가별
프랑스
독일
이탈리아
네덜란드
러시아
스페인
터키
영국
기타 유럽
중동
국가별
이란
사우디아라비아
기타 중동
북미
국가별
캐나다
멕시코
미국
기타 북미
남미
국가별
아르헨티나
브라질
기타 남미
제6장 경쟁 구도
주요 전략 동향
시장 점유율 분석
기업 상황
기업 프로파일
Andermatt Group AG
Biolchim SPA
Bioworks Inc.
Certis USA LLC
Corteva Agriscience
Indogulf BioAg LLC(Biotech Division of Indogulf Company)
Koppert Biological Systems Inc.
Lallemand Inc.
Marrone Bio Innovations Inc.
Seipasa SA
제7장 CEO에 대한 주요 전략적 질문
제8장 부록
세계 개요
개요
Five Forces 분석 프레임워크
세계의 밸류체인 분석
시장 역학(DROs)
정보원과 참고문헌
도표 일람
주요 인사이트
데이터 팩
용어집
KTH
영문 목차
영문목차
The Biofungicides Market size is estimated at 3.18 billion USD in 2025, and is expected to reach 5.34 billion USD by 2030, growing at a CAGR of 10.89% during the forecast period (2025-2030).
The global biofungicides market in 2022 was primarily driven by the production of row crops, with the main crops being barley, corn, wheat, rapeseed, rye, sunflower, soybean, and rice. These crops accounted for approximately 84.1% of the global biofungicides market in terms of value. North America dominates this segment of the market, with the United States being the leading country, accounting for 71.4% of the total market value. The consumption of biofungicides in row crops is expected to continue to grow due to the considerable extent of area under the cultivation of these crops in the United States.
Horticultural crops, including fruits and vegetables such as bananas, apples, grapes, tomatoes, onions, cucumbers, and cabbages, accounted for 12.3% of the global biofungicides market in 2022. The European region dominates this sub-segment of the market, accounting for a share of 68.4%. Italy, France, and Spain are the leading countries in this region, with Italy accounting for a share of 39.7%.
Cash crops, including coffee, tea, cocoa, cotton, tobacco, rubber, and sugarcane, accounted for 4.0% of the total global consumption of biofungicides in 2022. The European region dominates this sub-segment of the market, accounting for a share of 42.1%. France, Germany, and Italy are the leading countries in this region, with France accounting for a share of 34.2%.
The increased demand for organically produced fruits and vegetables, driven by health concerns, is expected to further boost the consumption of biofungicides in the crop segment of the market between 2023 and 2029.
In agriculture, Bacillus, Trichoderma, Streptomyces, and Pseudomonas are the most commonly utilized microorganisms as bio fungicides. They have proven effective against pathogens such as Pythium, Rhizoctonia, Fusarium, Sclerotinia, Thielaviopsis, Botrytis, and powdery mildew.
Europe is the largest market for biofungicides, accounting for a share of 41.1% in terms of value in 2022. France is the European Union's leading agricultural producer. Wheat, rye, barley, corn, sugar beet, and oats are among the major crops grown in the country. France accounted for a share of 27.5% of the European biofungicides market in terms of value in 2022. The high share percentage was primarily due to the country's extensive area under organic cultivation, accounting for 17.4% of the total organic area in the region in 2022.
North America is the second-largest consumer of biofungicides; it accounted for a share of 37.7% in 2022, valued at USD 826.8 million, which is expected to reach USD 1.76 billion by 2029. Government initiatives in North American countries like the United States, such as the Organic Certificate cost-share program, providing financial assistance to establish a cost-share buffer zone, and low-interest loans for organic farmers, help accelerate the use of biofungicides. The biofungicides market is anticipated to register a CAGR of 11.5% between 2023 and 2029.
The multiple modes of action and the role of a few biofungicides in both biocontrol and stimulating plant growth are expected to drive the market for biofungicides globally. The market is estimated to register a CAGR of 10.8% between 2023 and 2029.
Global Biofungicides Market Trends
Organic production is at an all-time high in North America and Europe, due to the increasing awareness and Government initiatives.
Organic agriculture has emerged as a significant contributor to sustainable food systems, with 187 countries practicing it globally. As of 2021, there was 72.3 million ha of organic agricultural land worldwide, with an average increase of 2.9% across all regions from 2018 to 2021. Organic arable land accounted for 14.4 million ha, representing 19.9% of the total organic agricultural land.
The strongest markets for organic farming are North America and Europe, accounting for 41.0% of the global organic arable land. In 2022, Europe had 6.5 million ha of organic arable land, equivalent to 44.1% of the overall organic arable agricultural area. The most significant crops grown organically in North America and Europe are apples, strawberries, cereals, and olives.
Developing countries in Asia-Pacific are also joining the organic agriculture movement and becoming self-sufficient in producing and providing fresh organic produce to meet their domestic demand. The trend of organic farming is gaining momentum in Asia-Pacific, with the region recording an 18.8% increase in organic arable land from 2017 to 2022. The major initiatives by governments in the region also play a vital role in the growing trend of organic farming. For example, Japan's Basic Plan for Food, Agriculture, and Rural Areas aims to triple the number of organic farmers and lands by 2030.
The growth of organic agriculture is driven by the rising awareness of the benefits of organic farming, such as promoting soil health, reducing environmental impacts, and producing healthier food.
Per capita spending of organic food majorly observed in United States and Germany, attributed to the consumer demand for healthier and sustainable food
The organic food market experienced significant growth in the past few years, with global sales reaching USD 120.6 billion in 2020, up from USD 70.8 billion in 2012. The trend toward organic food is being driven by several factors, such as increasing consumer demand for healthier, more sustainable food options and a growing awareness of the environmental impact of conventional agriculture. The global organic food market is expected to continue its growth trend over the coming years.
According to a survey conducted by the Organic Trade Association in 2021, sales of organic fruits and vegetables increased by around 4.5% in the same year, accounting for 15% of the overall organic sales. North America dominates the market in terms of average spending on organic products, with per capita spending in the United States reaching USD 186.7 in 2021, the highest among all North American countries. Europe is also expected to experience significant growth in the organic food market, with Germany accounting for the highest per capita spending of USD 75.6 in 2021.
While the organic food market is still dominated by developed countries with high consumer disposable incomes, it is also expected to grow in developing nations. For example, the increasing number of working-class people in the Asia-Pacific region may contribute to the market's expansion due to the growing availability and affordability of organic food products.
Biofungicides Industry Overview
The Biofungicides Market is fragmented, with the top five companies occupying 1.40%. The major players in this market are Bioworks Inc., Corteva Agriscience, Koppert Biological Systems Inc., Marrone Bio Innovations Inc. and Seipasa SA (sorted alphabetically).
Additional Benefits:
The market estimate (ME) sheet in Excel format
3 months of analyst support
TABLE OF CONTENTS
1 EXECUTIVE SUMMARY & KEY FINDINGS
2 REPORT OFFERS
3 INTRODUCTION
3.1 Study Assumptions & Market Definition
3.2 Scope of the Study
3.3 Research Methodology
4 KEY INDUSTRY TRENDS
4.1 Area Under Organic Cultivation
4.2 Per Capita Spending On Organic Products
4.3 Regulatory Framework
4.3.1 Argentina
4.3.2 Australia
4.3.3 Brazil
4.3.4 Canada
4.3.5 China
4.3.6 Egypt
4.3.7 France
4.3.8 Germany
4.3.9 India
4.3.10 Indonesia
4.3.11 Italy
4.3.12 Japan
4.3.13 Mexico
4.3.14 Netherlands
4.3.15 Nigeria
4.3.16 Philippines
4.3.17 Russia
4.3.18 South Africa
4.3.19 Spain
4.3.20 Thailand
4.3.21 Turkey
4.3.22 United Kingdom
4.3.23 United States
4.3.24 Vietnam
4.4 Value Chain & Distribution Channel Analysis
5 MARKET SEGMENTATION (includes market size in Value in USD and Volume, Forecasts up to 2030 and analysis of growth prospects)
5.1 Crop Type
5.1.1 Cash Crops
5.1.2 Horticultural Crops
5.1.3 Row Crops
5.2 Region
5.2.1 Africa
5.2.1.1 By Country
5.2.1.1.1 Egypt
5.2.1.1.2 Nigeria
5.2.1.1.3 South Africa
5.2.1.1.4 Rest of Africa
5.2.2 Asia-Pacific
5.2.2.1 By Country
5.2.2.1.1 Australia
5.2.2.1.2 China
5.2.2.1.3 India
5.2.2.1.4 Indonesia
5.2.2.1.5 Japan
5.2.2.1.6 Philippines
5.2.2.1.7 Thailand
5.2.2.1.8 Vietnam
5.2.2.1.9 Rest of Asia-Pacific
5.2.3 Europe
5.2.3.1 By Country
5.2.3.1.1 France
5.2.3.1.2 Germany
5.2.3.1.3 Italy
5.2.3.1.4 Netherlands
5.2.3.1.5 Russia
5.2.3.1.6 Spain
5.2.3.1.7 Turkey
5.2.3.1.8 United Kingdom
5.2.3.1.9 Rest of Europe
5.2.4 Middle East
5.2.4.1 By Country
5.2.4.1.1 Iran
5.2.4.1.2 Saudi Arabia
5.2.4.1.3 Rest of Middle East
5.2.5 North America
5.2.5.1 By Country
5.2.5.1.1 Canada
5.2.5.1.2 Mexico
5.2.5.1.3 United States
5.2.5.1.4 Rest of North America
5.2.6 South America
5.2.6.1 By Country
5.2.6.1.1 Argentina
5.2.6.1.2 Brazil
5.2.6.1.3 Rest of South America
6 COMPETITIVE LANDSCAPE
6.1 Key Strategic Moves
6.2 Market Share Analysis
6.3 Company Landscape
6.4 Company Profiles (includes Global Level Overview, Market Level Overview, Core Business Segments, Financials, Headcount, Key Information, Market Rank, Market Share, Products and Services, and Analysis of Recent Developments).
6.4.1 Andermatt Group AG
6.4.2 Biolchim SPA
6.4.3 Bioworks Inc.
6.4.4 Certis USA LLC
6.4.5 Corteva Agriscience
6.4.6 Indogulf BioAg LLC (Biotech Division of Indogulf Company)
6.4.7 Koppert Biological Systems Inc.
6.4.8 Lallemand Inc.
6.4.9 Marrone Bio Innovations Inc.
6.4.10 Seipasa SA
7 KEY STRATEGIC QUESTIONS FOR AGRICULTURAL BIOLOGICALS CEOS