ㅁ Add-on 가능: 고객의 요청에 따라 일정한 범위 내에서 Customization이 가능합니다. 자세한 사항은 문의해 주시기 바랍니다.
ㅁ 보고서에 따라 최신 정보로 업데이트하여 보내드립니다. 배송기일은 문의해 주시기 바랍니다.
한글목차
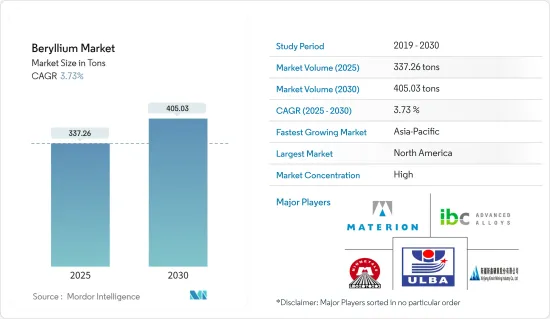
베릴륨 시장 규모는 2025년에 337.26톤에 달할 것으로 추정됩니다. 예측기간(2025-2030년)의 CAGR은 3.73%를 나타낼 것으로 전망되고, 2030년에는 405.03톤에 이를 것으로 예상되고 있습니다.
베릴륨 시장은 COVID-19에 의한 좌절에 직면했습니다. 세계의 가동 중단과 엄격한 정부 규제로 인해 생산 기지가 광범위한 가동 중단에 몰렸습니다. 그러나 시장은 2021년에 회복되어 향후 몇 년간 크게 성장했습니다.
주요 하이라이트
단기적으로는 전자 및 통신 인프라 수요 증가와 항공우주 및 군사 응용 분야에서 베릴륨 합금의 광범위한 사용이 시장 수요를 견인합니다.
그러나 잠재적인 대체품과의 경쟁이 시장 성장을 방해할 것으로 예상됩니다.
그럼에도 불구하고 원자력 발전에서 산화 베릴륨의 미래 수요와 베릴륨 미러의 새로운 용도는 조사 대상 시장에 새로운 기회를 창출할 것으로 예상됩니다.
북미는 세계 시장을 독점할 것으로 예상되며, 수요의 대부분은 미국과 캐나다에서 유래합니다.
베릴륨 시장 동향
전자 및 통신 부문이 시장을 독점
베릴륨의 주요 최종 사용자 산업으로서 가전과 통신이 두드러집니다. 베릴륨은 주로 구리와 합금화되어 구리-베릴륨 합금을 형성합니다. 이 합금은 케이블, 고화질 TV, 전기 접점, 휴대폰 및 컴퓨터 커넥터, 컴퓨터 칩 방열판, 수중 광섬유 케이블, 소켓, 서모스탯, 벨로우즈 등 다양한 제품에 사용됩니다.
베릴륨의 우수한 열전도성은 방열성을 높이고 과열의 위험을 줄이고 전자 부품의 신뢰성을 향상시킵니다.
센서, 안테나, 커패시터, 저항기 등의 전자 부품이 소형화·고성능화함에 따라, 이 진화하는 상황에서의 베릴륨의 중요성은 더욱 현저해지고 있습니다.
전자 산업은 세계에서 가장 크고 가장 빠르게 성장하는 산업 중 하나입니다. 현재의 디지털 시대에 전자 기기는 사람들의 삶에 큰 영향을 미치고 있습니다. 전자 가젯 수요는 지속적으로 증가하고 세계적으로 중요한 경제 견인 역할을 계속할 것으로 예상됩니다.
전자정보기술산업협회(JEITA)의 데이터에 따르면 2023년 세계 전자기기·IT산업은 전년 대비 3% 감소한 3조3,826억 달러에 달했습니다. 그러나 2024년에는 9% 성장해 3조 6,868억 달러를 기록해 회복했습니다.
인도는 중국에 이어 스마트폰 생산국입니다. Invest India에 따르면, 이 나라는 2025-2026년까지 1,260억 달러 상당의 휴대전화를 제조하는 것을 목표로 하고 있습니다. 세계적으로 스마트폰 수요는 현저하게 증가하고 있습니다. Telefonaktiebolaget LM Ericsson에 따르면 스마트폰 계약 수는 2027년까지 76억 9,000만대에 달할 것으로 전망되며, 전자 용도에서 조사된 시장의 이용이 확대되고 있습니다.
미국에서는 신속한 기술 발전과 활발한 R&D 활동이 최첨단 전자 제품에 대한 수요를 촉진하고 있습니다. 이 산업은 지속적이고 현저한 발전을 이루고 있습니다. Consumer Technology Association의 보고서에 따르면 미국의 가전제품 판매로 인한 소매수입은 2023년 4,850억 달러에 달했으며, 2024년에는 5,120억 달러에 이르렀습니다.
독일은 유럽 최대의 일렉트로닉스 산업을 자랑합니다. 독일 전기전자공업회(ZVEI)의 데이터에 따르면 2023년 이 부문의 총 매출은 2,381억 유로(약 2,580억 6,000만 달러)에 달했습니다. 세계 가정용 가전제품 시장의 주요 촉진요인으로는 기술의 진보, 급속한 도시화, 활황을 보이는 주택부문, 1인당 소득 증가, 생활수준의 향상, 가사에 있어서의 쾌적함의 중시의 고조, 소비자의 라이프스타일의 진화, 소규모 가구 증가 등이 있습니다.
이러한 움직임으로 인해 전자기기와 통신 수요가 증가하고 베릴륨 수요도 증가할 것으로 보입니다.
시장을 독점하는 북미
북미는 베릴륨 시장을 선도하고 예측 기간 동안 가장 급성장하는 지역입니다. 이 급성장은 주로 자동차, 헬스케어, 항공우주 및 방위, 석유 및 가스, 일렉트로닉스 및 통신 등 다양한 섹터, 특히 미국과 캐나다 수요 증가가 배경에 있습니다.
미국 지질조사소에 따르면 미국은 세계 최대의 베릴륨 광산 생산국으로 2023년 생산량은 190톤에 달하고, 2022년 175톤에서 증가했습니다.
베릴륨 자원의 약 60%는 미국에 있으며, 주로 유타의 스폴 마운틴 지역에 존재하며 거기에는 대규모 벨트 란다이트 소스를 포함한 에피서멘탈 광상이 있습니다. 유타의 벨트랜디트 확인 매장량과 추정 매장량은 함유 베릴륨량으로 약 2만 톤으로 추정되고 있습니다.
베릴륨은 열전도성, 강도, 내식성이 뛰어나 브레이크 디스크, 점화 스위치, 에어백 센서, 파워트레인 부품, 전기 부품 등 다양한 용도에 이상적인 재료이기 때문에 자동차 산업에서 사용되고 있습니다. 이 지역에서 자동차 생산량이 증가함에 따라 베릴륨 수요도 증가할 것으로 예상됩니다.
미국은 중국에 이어 세계 2위 자동차 산업을 자랑하며 지역 및 세계 시장에서 매우 중요한 역할을 하고 있습니다. OICA(Organisation Internationale des Constructeurs Automobiles)의 데이터에 따르면, 미국의 자동차 생산 대수는 2023년에 1,061만 1,555대에 이르렀고, 2022년부터 5.56% 증가해, 베릴륨 수요를 강화했습니다.
캐나다 자동차 공업회의 보고서에 따르면 자동차 부문은 캐나다의 GDP에 190억 달러 이상 기여하고 있습니다. 이 기여로 인해 2024년에 401억 달러로 증가했고 베릴륨 시장에 성장 기회를 가져왔습니다. OICA의 데이터에 따르면 캐나다의 2023년 자동차 생산 대수는 155만 3,026대로 전년 대비 25.92% 증가했습니다.
베릴륨의 높은 열 전도성과 탁월한 강도 대 중량비는 항공우주와 방어에서 매우 중요합니다. 고속 항공기, 미사일, 로켓 엔진의 노즐에 채용되고 있습니다. 이 지역에서는 항공우주 및 방위 섹터가 확대되고 있어 베릴륨 수요는 증가할 것으로 보입니다.
미국은 북미 최대 항공시장을 갖고 세계 유수의 보유기수를 자랑합니다. 프랑스, 중국, 독일 등 국가로의 항공우주 부품 수출이 호조로 이 산업의 제조 활동을 뒷받침해 베릴륨 시장에 플러스의 영향을 주고 있습니다.
연방 항공국(FAA)에 따르면 항공 여행과 화물 수요의 급회복에 힘입어 민간 항공기의 기체 수는 2022-2023년에 0.2% 증가했습니다. 게다가 미국 항공사의 탑승자 수는 향후 20년간 연률 2.4%로 성장해 2023년 9,220억 달러, 2044년 1조 3,200억 달러에 달할 것으로 추정되며, 미국의 주력 제트기 보유수는 2023년 4,832기에서 2044년에 6,894기에 이를 것으로 전망됩니다.
전자 분야에서 베릴륨의 높은 열전도성과 비자성은 전기 접점, 반도체, 통신에 필수적입니다. 이 지역에서 일렉트로닉스 섹터가 성장함에 따라 베릴륨 수요도 향후 수년간 성장할 것으로 예상됩니다.
미국의 전자부문은 첨단기술제품에 대한 수요의 급증과 활발한 R&D 활동에 의해 박차를 가한 급속한 기술 혁신에 의해 완만한 성장궤도를 타고 있습니다.
에너지부(DOE)는 2024년 4월 바이든 대통령의 초당파 인프라법에 따라 조합원의 노동력을 우선으로 새로운 송전선에 최대 3억 3,100만 달러를 투자할 계획을 발표했습니다. 또한 이 정권은 향후 5년간 10만 마일의 송전선을 개량하는 것을 목표로 관민의 리더들과 협력하여 전미의 송전망을 강화하는 이니셔티브를 주도하고 있습니다.
높은 강도와 전도성을 가지는 베릴륨은 다운홀·튜빙으로부터 컴프레서나 발전기에 이르기까지, 석유 및 가스 분야에서의 용도를 찾아내고 있습니다. 이 지역의 석유 및 가스 섹터의 확대에 따라, 베릴륨 수요는 향후 수년에 증가할 것으로 보입니다.
캐나다 통계국에 따르면 2023년 캐나다 원유 생산량은 3년 연속 증가하여 전년대비 1.4% 증가한 2억 8,640만 입방미터를 기록했습니다. 게다가 캐나다 에너지 계약자 협회의 예측에 따르면 2024년에 굴착된 유정은 6,229개로, 2023년부터 481개 증가했으며, 오일샌드 생산자가 확대 국면에 있었음이 분명합니다.
이러한 움직임을 감안하면 북미는 예측기간 중에 베릴륨 수요가 급증하는 자세입니다.
베릴륨 산업의 세분화
베릴륨 시장은 고도로 통합되어 있습니다. 주요 기업는 마테리온 코퍼레이션, 울바 메탈루지컬 플랜트(카자톰프롬), 후안 슈이쿠산 논퍼러스 메탈 그룹, IBC Advanced Alloys, Xinjiang Xinxin Mining Industry 등입니다.
기타 혜택 :
엑셀 형식 시장 예측(ME) 시트
3개월간의 애널리스트 서포트
목차
제1장 서론
조사의 전제조건
조사 범위
제2장 조사 방법
제3장 주요 요약
제4장 시장 역학
성장 촉진요인
일렉트로닉스 및 통신 인프라로부터 수요 증가
뛰어난 특성에 의한 의료기기에서의 사용 증가
기타 촉진요인
성장 억제요인
대체품과의 경쟁
기타 억제요인
산업 밸류체인 분석
Porter's Five Forces 분석
공급기업의 협상력
소비자의 협상력
신규 참가업체의 위협
대체품의 위협
경쟁 기업 간 경쟁 강도
제5장 시장 세분화
제품 유형
합금
금속
세라믹
기타 제품 유형
최종 사용자 산업
산업용 부품
자동차
헬스케어
항공우주 및 방위
석유 및 가스
일렉트로닉스 및 통신
기타 최종 사용자 산업
지역
아시아태평양
중국
인도
일본
한국
말레이시아
태국
인도네시아
베트남
기타 아시아태평양
북미
미국
캐나다
멕시코
유럽
독일
영국
프랑스
이탈리아
스페인
북유럽 국가
터키
러시아
기타 유럽
남미
브라질
아르헨티나
콜롬비아
기타 남미
중동 및 아프리카
사우디아라비아
카타르
아랍에미리트(UAE)
나이지리아
이집트
남아프리카
기타 중동 및 아프리카
제6장 경쟁 구도
M&A, 합작사업, 제휴, 협정
시장 점유율**/랭킹 분석
주요 기업의 전략
기업 프로파일
American Beryllia Inc.
American Elements
Belmont Metals
Hunan Shuikoushan Nonferrous Metals Group Co. Ltd
IBC Advanced Alloys
Materion Corporation
NGK Metals
Texas Mineral Resources Corp.
Tropag Oscar H. Ritter Nachf GmbH
Ulba Metallurgical Plant(kazatomprom)
Xiamen Beryllium Copper Technologies Co. Ltd
Xinjiang Xinxin Mining Industry Co. Ltd
제7장 시장 기회와 앞으로의 동향
원자력발전에 있어서 산화베릴륨의 장래 수요
베릴륨 미러의 새로운 용도
기타 기회
KTH
영문 목차
영문목차
The Beryllium Market size is estimated at 337.26 tons in 2025, and is expected to reach 405.03 tons by 2030, at a CAGR of 3.73% during the forecast period (2025-2030).
The beryllium market faced setbacks due to COVID-19. Global lockdowns and stringent government regulations led to widespread shutdowns of production hubs. However, the market rebounded in 2021, and it is estimated to witness significant growth in the upcoming years.
Key Highlights
Over the short term, the growing demand from electronics and telecommunication infrastructure and extensive usage of beryllium alloys in aerospace and military applications drive the market's demand.
However, competition from potential alternatives is expected to hinder the market's growth.
Nevertheless, future demand for beryllium oxide in nuclear power generation and emerging applications of beryllium mirrors are expected to create new opportunities for the market studied.
North America is expected to dominate the global market, with the majority of demand coming from the United States and Canada.
Beryllium Market Trends
Electronics and Telecommunications Segment to Dominate the Market
Consumer electronics and telecommunications stand out as key end-user industries for beryllium. Beryllium is predominantly alloyed with copper in these applications, forming copper-beryllium alloys. These alloys find their way into various products, including cables, high-definition televisions, electrical contacts, cell phone and computer connectors, computer chip heat sinks, underwater fiber optic cables, sockets, thermostats, and bellows.
Beryllium's excellent thermal conductivity enhances heat dissipation, mitigating overheating risks and bolstering the reliability of electronic components.
As electronic components like sensors, antennas, capacitors, and resistors shrink and gain capabilities, beryllium's significance in this evolving landscape becomes even more pronounced.
The electronics industry is one of the world's largest and fastest growing. In the current digital era, electronic items significantly impact people's lives. The demand for electronic gadgets is projected to rise continuously and remain a significant economic driver globally.
As per data from the Japan Electronics and Information Technology Industries Association (JEITA), the global electronics and IT industry saw a 3% year-over-year decline in 2023, totaling USD 3,382.6 billion. However, a rebound is anticipated, with projections of a 9% growth in 2024, reaching USD 3,686.8 billion.
India is the second largest smartphone producer after China. As per Invest India, the country aims to manufacture cell phones worth USD 126 billion by 2025-26. Globally, the demand for smartphones is increasing at a significant rate. According to the Telefonaktiebolaget LM Ericsson, the subscription is likely to reach 7,690 million by 2027, enhancing the usage of the market studied from electronics applications.
In the United States, swift technological advancements and robust R&D activities fuel a demand for cutting-edge electronic products. The industry is witnessing continuous and significant progress. The Consumer Technology Association reports that retail revenue from US consumer electronics sales reached an impressive USD 485 billion in 2023, with projections for 2024 set at USD 512 billion.
Germany boasts the largest electronics industry in Europe. Data from the Germany Electrical and Electronics Association (ZVEI) indicates that the sector achieved an aggregated turnover of EUR 238.1 billion (approximately USD 258.06 billion) in 2023. Key drivers for the global household appliances market include technological advancements, rapid urbanization, a booming housing sector, rising per capita income, enhanced living standards, a growing emphasis on comfort in household chores, evolving consumer lifestyles, and an increasing number of smaller households.
Given these dynamics, the demand for electronics and telecommunications is set to rise, subsequently fueling the demand for beryllium.
North America to Dominate the Market
North America is poised to lead the beryllium market, emerging as the region with the fastest growth during the forecast period. This surge is primarily fueled by increasing demands across various sectors, including automotive, healthcare, aerospace and defense, oil and gas, and electronics and telecommunications, particularly in the United States and Canada.
As per the US Geological Survey, the United States was the world's largest beryllium mine producer, with production amounting to 190 metric tons in 2023, growing from 175 tons in 2022.
About 60% of beryllium resources are in the United States, mainly in the Spor Mountain area in Utah, where the epithermal deposit contains a large bertrandite source. Proven and probable bertrandite reserves in Utah are estimated at about 20,000 tons of contained beryllium.
Beryllium is used in the automotive industry due to its high thermal conductivity, strength, and resistance to corrosion, making it an ideal material for various applications, including brake discs, ignition switches, airbag sensors, powertrain components, and electrical components. As vehicle production rises in the region, the demand for beryllium is expected to bolster.
The United States boasts the world's second-largest automotive industry, trailing only China, and plays a pivotal role in regional and global markets. Data from the Organisation Internationale des Constructeurs Automobiles (OICA) indicates that the US automotive production reached 10,611,555 units in 2023, marking a 5.56% increase from 2022, bolstering the demand for beryllium.
As reported by the Automotive Industries Association of Canada, the automotive sector contributes over USD 19 billion to Canada's GDP. Projections suggest this contribution will rise to USD 40.1 billion in 2024, presenting growth opportunities for the beryllium market. OICA data shows Canada produced 1,553,026 vehicles in 2023, a 25.92% increase from the prior year.
Beryllium's high thermal conductivity and exceptional strength-to-weight ratio render it crucial in aerospace and defense. It is employed in high-speed aircraft, missiles, and rocket engine nozzles. With the aerospace and defense sector expanding in the region, the demand for beryllium is set to rise.
The United States has the largest aviation market in North America and boasts one of the world's most extensive fleet sizes. Strong exports of aerospace components to nations like France, China, and Germany are propelling the industry's manufacturing activities, positively influencing the beryllium market.
According to the Federal Aviation Administration (FAA), boosted by the sharp recovery in demand for air travel and cargo, the number of aircraft in the commercial fleet grew by 0.2% in 2022-23. Additionally, US airline enplanements are estimated to grow 2.4% per year over the next 20 years to USD 1.32 trillion in 2044 compared to USD 922 billion in 2023, and projects the US mainline jet fleet to grow from 4,832 in 2023 to 6,894 in 2044.
In electronics, beryllium's high thermal conductivity and non-magnetic properties are essential for electrical contacts, semiconductors, and telecommunications. As the electronics sector grows in the region, the demand for beryllium is expected to grow in the coming years.
The US electronics sector is on a moderate growth trajectory, driven by a surge in demand for advanced technological products and rapid innovation spurred by robust R&D activities.
The Department of Energy (DOE), in April 2024, announced plans to invest up to USD 331 million in a new transmission line, prioritizing union labor, under President Biden's Bipartisan Infrastructure Law. Additionally, the administration is leading an initiative by collaborating with public and private sector leaders to enhance the nation's transmission network, aiming to upgrade 100,000 miles of transmission lines in the next five years.
With its high strength and conductivity, beryllium finds applications in the oil and gas sector, from down-hole tubing to compressors and generators. With the expanding oil and gas sector in the region, the demand for beryllium is set to rise in the coming years.
Statistique Canada reports that Canada's crude oil production rose for the third consecutive year in 2023, hitting 286.4 million cubic meters, a 1.4% increase from the previous year. Moreover, with projections from the Canadian Association of Energy Contractors anticipating 6,229 wells to be drilled in 2024, up 481 from 2023, it is evident that oil sand producers are in an expansion phase.
Given these dynamics, North America is poised for a surge in beryllium demand during the forecast period.
Beryllium Industry Segmentation
The beryllium market is highly consolidated. The major players include Materion Corporation, Ulba Metallurgical Plant (Kazatomprom), Hunan Shuikoushan Nonferrous Metals Group Co. Ltd, IBC Advanced Alloys, and Xinjiang Xinxin Mining Industry Co. Ltd.
Additional Benefits:
The market estimate (ME) sheet in Excel format
3 months of analyst support
TABLE OF CONTENTS
1 INTRODUCTION
1.1 Study Assumptions
1.2 Scope of the Study
2 RESEARCH METHODOLOGY
3 EXECUTIVE SUMMARY
4 MARKET DYNAMICS
4.1 Drivers
4.1.1 Growing Demand from Electronics and Telecommunication Infrastructure
4.1.2 Increasing Usage in Medical Equipment Owing to its Superior Properties
4.1.3 Other Drivers
4.2 Restraints
4.2.1 Competition from Potential Alternatives
4.2.2 Other Restraints
4.3 Industry Value Chain Analysis
4.4 Porter's Five Forces Analysis
4.4.1 Bargaining Power of Suppliers
4.4.2 Bargaining Power of Consumers
4.4.3 Threat of New Entrants
4.4.4 Threat of Substitute Products and Services
4.4.5 Degree of Competition
5 MARKET SEGMENTATION (Market Size in Volume)
5.1 Product Type
5.1.1 Alloys
5.1.2 Metals
5.1.3 Ceramics
5.1.4 Other Product Types
5.2 End-user Industry
5.2.1 Industrial Components
5.2.2 Automotive
5.2.3 Healthcare
5.2.4 Aerospace and Defense
5.2.5 Oil and Gas
5.2.6 Electronics and Telecommunication
5.2.7 Other End-user Industries
5.3 Geography
5.3.1 Asia-Pacific
5.3.1.1 China
5.3.1.2 India
5.3.1.3 Japan
5.3.1.4 South Korea
5.3.1.5 Malaysia
5.3.1.6 Thailand
5.3.1.7 Indonesia
5.3.1.8 Vietnam
5.3.1.9 Rest of Asia-Pacific
5.3.2 North America
5.3.2.1 United States
5.3.2.2 Canada
5.3.2.3 Mexico
5.3.3 Europe
5.3.3.1 Germany
5.3.3.2 United Kingdom
5.3.3.3 France
5.3.3.4 Italy
5.3.3.5 Spain
5.3.3.6 NORDIC Countries
5.3.3.7 Turkey
5.3.3.8 Russia
5.3.3.9 Rest of Europe
5.3.4 South America
5.3.4.1 Brazil
5.3.4.2 Argentina
5.3.4.3 Colombia
5.3.4.4 Rest of South America
5.3.5 Middle East and Africa
5.3.5.1 Saudi Arabia
5.3.5.2 Qatar
5.3.5.3 United Arab Emirates
5.3.5.4 Nigeria
5.3.5.5 Egypt
5.3.5.6 South Africa
5.3.5.7 Rest of Middle East and Africa
6 COMPETITIVE LANDSCAPE
6.1 Mergers and Acquisitions, Joint Ventures, Collaborations, and Agreements
6.2 Market Share **/Ranking Analysis
6.3 Strategies Adopted by Leading Players
6.4 Company Profiles
6.4.1 American Beryllia Inc.
6.4.2 American Elements
6.4.3 Belmont Metals
6.4.4 Hunan Shuikoushan Nonferrous Metals Group Co. Ltd