ㅁ Add-on 가능: 고객의 요청에 따라 일정한 범위 내에서 Customization이 가능합니다. 자세한 사항은 문의해 주시기 바랍니다.
ㅁ 보고서에 따라 최신 정보로 업데이트하여 보내드립니다. 배송기일은 문의해 주시기 바랍니다.
한글목차
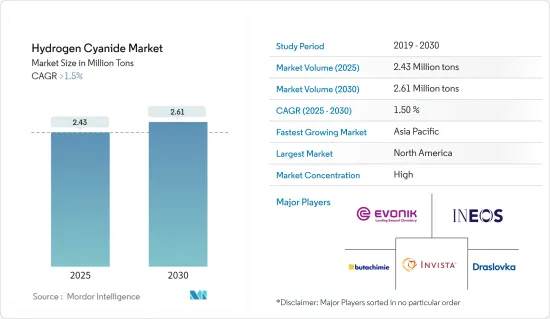
시안화수소 시장 규모는 2025년에 243만 톤으로 추정되고, 예측 기간인 2025-2030년 CAGR은 1.5%로 성장할 전망이며, 2030년에는 261만 톤에 달할 것으로 예측됩니다.
제조되는 시안화수소의 대부분은 아디포니트릴 제조의 원료로 사용되며, 섬유 및 플라스틱 제조용 나일론 66의 제조에 사용됩니다. 아디포니트릴(AND)은 헥사메틸렌디아민(HMDA)의 제조에 사용되며, 대부분(약 92%)은 나일론 6,6 섬유 및 수지의 제조에 사용됩니다.
중기적으로는 시안화나트륨과 시안화칼륨 수요 증가 및 아디포니트릴 제조 시안화수소의 사용 증가가 시장 성장을 가속하는 주요 요인이었습니다.
반면 시안화수소는 독성이 강하기 때문에 시장 성장을 방해하고 있습니다.
미개척 시장에서 킬레이트제 생산 시안화수소의 사용은 미래에 기회를 가져올 가능성이 높습니다.
북미는 세계의 시안화수소 시장을 독점할 것으로 예상되며, 아시아태평양은 예측 기간 동안 가장 급성장하는 시장이 될 것으로 예상됩니다.
시안화수소 시장 동향
시안화나트륨 및 칼륨의 용도가 가장 급성장하는 부문으로
시안화나트륨 및 시안화칼륨의 전구체인 시안화수소는 전기도금이나 금, 은 등의 금속 채굴에 일반적으로 사용됩니다.
습식법에서는 시안화나트륨(NaCN) 또는 시안화수소를 수산화나트륨으로 중화하여 제조합니다. 시안화수소는 기체 또는 액체 형태로 첨가되고, NaOH는 수용액으로서 첨가되어 NaCN 수용액을 형성합니다. 또한, NaCN 수용액의 증발 중에 고체 NaCN 결정이 형성될 수 있습니다.
시안화나트륨 및 시안화칼륨은 모두 금 추출, 전기도금, 화학 제조 등 다양한 산업 공정에서 사용되는 중요한 화학 물질입니다.
시안화나트륨 및 시안화칼륨은 저품위 광석에서 금과 은을 추출하는데 주로 사용됩니다.
시안화칼륨 및 시안화나트륨은 니트릴과 카르복실산의 제조에도 널리 사용되고 있습니다.
미국의 지질조사소에 따르면 2022년 세계 금 생산량은 3,100톤에 달했습니다. 중국은 세계 금광산 생산을 선도하였고, 2022년 생산량은 330톤, 이어 호주는 같은 해 약 320톤을 생산했습니다.
예상 금 매장량이 가장 많은 국가는 호주, 러시아, 남아프리카입니다. 또한 캐나다의 광업은 세계 최대의 칼리 생산국이며 금 생산국 톱 5에 들어 있습니다. 캐나다에서 가장 새로운 금광산인 온타리오주의 퓨어 골드 레드레이크 광산 프로젝트는 2021년 8월 상업 운전을 시작하고 연간 87.8코스의 금을 추가할 것으로 추정되었습니다.
러시아 우크라이나 침공에 이어 화학업계는 2022년 에너지와 원재료 비용 상승, 팬데믹, 경제 불확실성, 정치적 혼란에 의해 이미 긴장 상태에 있는 세계 공급망에 추가 병목 현상이 발생하는 1년을 경험했습니다.
BASF가 발표한 보고서 2022에 따르면 2023년 세계 화학제품 생산량(의약품 제외)은 2022년부터 전년대비 2.0% 증가, 전년대비 2.2% 증가할 것으로 전망되고 있습니다.
세계 최대의 화학 시장인 중국에서는 2023년에는 화학 생산의 성장이 약간 둔화될 것으로 예상됩니다. 이 나라의 화학 생산은 2022년 5.9% 증가했습니다. 중국 경제의 개방은 특히 소비재와 건강 및 영양 분야에서 중국 내수 성장을 뒷받침해 업계의 플러스 성장에 기여할 것으로 예상됩니다.
이러한 모든 요인을 고려하면 전체 시장은 예측 기간 동안 플러스 성장을 나타낼 것으로 예상됩니다.
시장을 독점하는 북미
ITC 무역지도에 따르면 미국은 2022년에 약 87톤의 시안화수소를 수출한 가장 큰 수출국이었습니다.
현재 시안 제품 금지에 관한 국가 전체에 큰 규제는 없습니다. 그러나 몬타나, 콜로라도, 위스콘신 등에서는 국내에서 특정 시안화물 사용을 방지하는 몇 가지 규정이 있습니다.
이 지역에서 시안화수소 수요는 나일론과 폴리아미드의 생산에 사용되는 아디포니트릴의 생산, 도료나 코팅제에 사용되는 아크릴 플라스틱용 아세톤 시아노히드린의 생산, 금 회수용의 시안화나트륨 및 시안화칼륨의 생산, 농약 및 기타 농업 제품용 염화시아누르 등의 용도에 의해 견인되고 있습니다.
이 나라는 세계 유수의 금과 은의 산출국입니다. 미국 지질조사소에 따르면 2022년, 이 나라는 세계 제5위의 금생산국으로 총생산량은 약 170톤이었습니다.
실버 인스티튜트에 따르면 2022년 미국의 은 생산량은 세계 9위로 4,110만 온스(-1,165.17톤)와 2021년 생산량을 6% 웃돌았습니다.
위의 용도와 함께 시안화수소를 사용하여 제조되는 염화시아누르는 농약 및 기타 농산물의 제조에도 사용되기 때문에 이 나라에서 조사된 시장 수요는 이 나라의 농업 산업에 의해서도 견인되고 있습니다.
플라스틱 산업에 의한 아세톤 시아노히드린 수요는 시장의 소비에 더욱 박차를 가하고 있습니다.
플라스틱 산업의 성장은 현재 대량의 플라스틱 폐기물로 인한 환경 오염 증가에 영향을 받고 있습니다. 캐나다 정부에 따르면, 이 나라에서는 연간 약 150억 장의 비닐봉지 및 약 5,700만 개의 플라스틱 빨대가 사용되고 있습니다.
시안화수소를 주성분으로 하는 화학약품, 즉 시안화나트륨 및 시안화칼륨은 금과 은의 채굴 과정에서 중요한 용도를 발견하고 있습니다.
USGS에 따르면 이 나라는 중국, 호주, 러시아에 이은 4위 금 생산국으로 2022년 금 생산량은 약 220톤이었습니다.
또한 은의 주요 생산국 톱 15에도 들어 있습니다. 실버 인스티튜트에 따르면 정부의 은 생산량은 약 870만 온스(246.64톤)로 2021년에 비해 약 5% 감소했습니다.
농업에 의한 살충제 등 수요도, 이 나라의 시안화수소의 대량 소비에 공헌하고 있습니다.
농업은 캐나다 경제에 크게 기여하고 있습니다. 캐나다 농업 식량성(AAFC)에 따르면, 2022년 캐나다는 세계 5위의 농산물 수출국이 되었습니다.
이러한 모든 동향은 예측 기간 동안 시장 수요에 영향을 미칠 것으로 보입니다.
시안화수소 산업 개요
세계의 시안화수소 시장은 부분적으로 통합되어 있습니다. 주요 기업으로는 INVISTA, Evonik Industries, INEOS, Butachimie Chalampe, Drasslok, and Asahi Kasei Corporation 등이 있습니다.(순부동)
기타 혜택 :
엑셀 형식 시장 예측(ME) 시트
3개월간의 애널리스트 서포트
목차
제1장 서론
조사 전제조건
조사 범위
제2장 조사 방법
제3장 주요 요약
제4장 시장 역학
성장 촉진요인
시안화나트륨 및 시안화칼륨의 제조에 대한 유리한 수요
아디포니트릴 제조에서 시안화수소의 사용량 증가
성장 억제요인
시안화수소의 높은 독성
산업 밸류체인 분석
Porter's Five Forces 분석
공급기업의 협상력
소비자의 협상력
신규 참가업체의 위협
대체품의 위협
경쟁도
제5장 시장 세분화
구조 유형별
시안화수소 액체
시안화수소 가스
용도별
시안화나트륨 및 시안화칼륨
아디포니트릴
아세톤 시아노히드린
기타 용도
지역별
아시아태평양
중국
인도
일본
한국
인도네시아
말레이시아
태국
베트남
기타 아시아태평양
북미
미국
캐나다
멕시코
유럽
독일
영국
이탈리아
프랑스
스페인
러시아
튀르키예
북유럽 국가
기타 유럽
남미
브라질
아르헨티나
기타 남미
중동 및 아프리카
사우디아라비아
남아프리카
기타 중동 및 아프리카
제6장 경쟁 구도
M&A, 합작사업, 제휴 및 협정
시장 점유율 분석(%)** 및 랭킹 분석
주요 기업의 전략
기업 프로파일
Air Liquide
Asahi Kasei Corporation
Ascend Performance Materials
Butachimie
Draslovka
Evonik Industries AG
Hindusthan Chemicals Company
INEOS
INVISTA
Kuraray Co. Ltd
Matheson Tri-Gas Inc.
Sumitomo Chemical Co. Ltd
Taekwang Industrial Co. Ltd
제7장 시장 기회 및 향후 동향
AJY
영문 목차
영문목차
The Hydrogen Cyanide Market size is estimated at 2.43 million tons in 2025, and is expected to reach 2.61 million tons by 2030, at a CAGR of greater than 1.5% during the forecast period (2025-2030).
The majority of the hydrogen cyanide manufactured is used as a raw material for adiponitrile production, which is used in producing nylon 66 for fiber and plastic production. Adiponitrile (AND) is used to make hexamethylene diamine (HMDA), the majority of which (approximately 92%) is used to make nylon 6,6 fibers and resins.
Over the medium term, the major factors driving market growth were the high demand for sodium and potassium cyanide and the increasing use of hydrogen cyanide in producing adiponitrile.
On the flip side, the highly toxic nature of hydrogen cyanide hampers the market's growth studied.
Its use in the production of chelating agents in untapped markets is likely to present opportunities in the future.
North America is expected to dominate the global hydrogen cyanide market, while the Asia-Pacific region is expected to be the fastest-growing market during the forecast period.
Hydrogen Cyanide Market Trends
Sodium and Potassium Cyanide Application to be the Fastest Growing Segment
Hydrogen cyanide, as a precursor of sodium cyanide and potassium cyanide, is commonly used for electroplating and mining of metals such as silver and gold.
The wet process produces sodium cyanide (NaCN) or the neutralization of hydrogen cyanide with sodium hydroxide. The HCN is added both in the form of a gas or liquid, and NaOH is added as an aqueous solution to form an aqueous NaCN solution. Furthermore, solid NaCN crystals can be formed during evaporation of the aqueous NaCN solution.
Potassium cyanide (KCN) is formed by the treatment of hydrogen cyanide with an aqueous potassium hydroxide solution, followed by the vacuum evaporation of the solution.
Both sodium cyanide and potassium cyanide are important chemicals used in various industrial processes, including gold extraction, electroplating, and chemical manufacturing.
Sodium cyanide and potassium cyanide are majorly used in the extraction of gold and silver from low-grade ores.
Potassium cyanide and sodium cyanide are also widely used for the production of nitriles and carboxylic acids.
According to the US Geological Survey, in 2022, global gold production reached 3,100 metric tons. China led global gold mine production, with an estimated 330 metric tons produced in 2022, followed by Australia, producing about 320 metric tons in the same year.
The countries with the largest estimated gold reserves are Australia, Russia, and South Africa. Furthermore, Canada's mining industry is the world's biggest producer of potash and is in the top five producers of gold. The Pure Gold Red Lake Mine project in Ontario, Canada's newest gold mine, began commercial operations in August 2021 and was estimated to add 87.8 koz of gold yearly.
Following Russia's invasion of Ukraine, the chemical industry experienced a year marked by further bottlenecks in global supply chains already strained by rising energy and raw material costs, a pandemic, economic uncertainty, and political turmoil in 2022.
According to a report published by BASF 2022, global chemical production (excluding pharmaceuticals) is expected to increase by 2.0% in 2023, with a Y-o-Y increase of 2.2% from 2022.
In China, the world's largest chemicals market, a slight slowdown in chemical production growth is expected in 2023. The country's chemical production grew by 5.9% in 2022. The opening up of the Chinese economy is expected to boost domestic demand growth in China, especially in the consumer goods and health and nutrition sectors, and contribute to positive growth in the industry.
With the consideration of all these factors, the overall market is expected to witness positive growth during the forecast period.
North America to Dominate the Market
According to the ITC trade map, the United States was the largest exporter of hydrogen cyanide in the year 2022, exporting about 87 tons of hydrogen cyanide in 2022.
Currently, there are no major country-wide regulations regarding the cyanide product ban. However, states such as Montana, Colorado, and Wisconsin have some restrictions preventing specific cyanide usage in the country.
The demand for hydrogen cyanide in the region is driven by applications such as the production of adiponitrile, which is used for nylon and polyamides production; the production of acetone cyanohydrin for acrylic plastics, which is further used in paints and coatings; for production of sodium cyanide and potassium cyanide for gold recovery, and cyanuric chloride for pesticides and other agriculture products.
The country is among the world's major producers of gold and silver. According to the US Geological Survey, in 2022, the country was the 5th largest producer of gold globally, with a total production of about 170 metric tons.
According to the Silver Institute, the United States was the world's ninth-largest producer of silver in 2022, producing 41.1 million ounces (~1,165.17 metric tons) of silver, which is 6% more than the production in 2021.
Along with the abovementioned applications, the demand for the market studied in the country is also driven by the agricultural industry in the country, as cyanuric chloride produced using hydrogen cyanide is also used for the production of pesticides and other agricultural products.
Plastic industries' demand for acetone cyanohydrin further adds to the market's consumption.
The plastic industry's growth is currently affected by increasing environmental pollution due to the huge amount of plastic waste. According to the Canadian government, about 15 billion plastic bags and about 57 million plastic straws are used annually in the country.
Hydrogen cyanide-based chemicals, i.e., sodium cyanide and potassium cyanide, find significant applications in the mining process of gold and silver.
According to USGS, the country is 4th largest producer of gold after China, Australia, and Russia, with gold production of about 220 tons in the year 2022.
The country is also among the top 15 major silver-producing nations in the world. According to the Silver Institute, the government has produced about 8.7 million ounces of silver (246.64 metric tons ), a decline of about 5% compared to 2021.
The agriculture industry's demand for pesticides and other products also contributes to the country's significant consumption of hydrogen cyanide.
The agriculture industry is a significant contributor to the Canadian economy. Agriculture and Agri-Food Canada (AAFC) said that in 2022, Canada was the world's fifth largest agricultural exporter.
All such trends are likely to impact the market demand over the forecast period.
Hydrogen Cyanide Industry Overview
The global hydrogen cyanide market is partially consolidated. The major companies include (not in a particular order) INVISTA, Evonik Industries, INEOS, Butachimie Chalampe, Drasslok, and Asahi Kasei Corporation, among others.
Additional Benefits:
The market estimate (ME) sheet in Excel format
3 months of analyst support
TABLE OF CONTENTS
1 INTRODUCTION
1.1 Study Assumptions
1.2 Scope of the Study
2 RESEARCH METHODOLOGY
3 EXECUTIVE SUMMARY
4 MARKET DYNAMICS
4.1 Drivers
4.1.1 Favorable Demand for Manufacturing of Sodium Cyanide and Potassium Cyanide
4.1.2 Increasing Usage of Hydrogen Cyanide for the Production of Adiponitrile
4.2 Restraints
4.2.1 Highly Toxic Nature of Hydrogen Cyanide
4.3 Industry Value-Chain Analysis
4.4 Porter's Five Forces Analysis
4.4.1 Bargaining Power of Suppliers
4.4.2 Bargaining Power of Consumers
4.4.3 Threat of New Entrants
4.4.4 Threat of Substitute Products and Services
4.4.5 Degree of Competition
5 MARKET SEGMENTATION (Market Size in Volume)
5.1 Structure Type
5.1.1 Hydrogen Cyanide Liquid
5.1.2 Hydrogen Cyanide Gas
5.2 Application
5.2.1 Sodium Cyanide and Potassium Cyanide
5.2.2 Adiponitrile
5.2.3 Acetone Cyanohydrin
5.2.4 Other Applications
5.3 Geography
5.3.1 Asia-Pacific
5.3.1.1 China
5.3.1.2 India
5.3.1.3 Japan
5.3.1.4 South Korea
5.3.1.5 Indonesia
5.3.1.6 Malaysia
5.3.1.7 Thailand
5.3.1.8 Vietnam
5.3.1.9 Rest of Asia-Pacific
5.3.2 North America
5.3.2.1 United States
5.3.2.2 Canada
5.3.2.3 Mexico
5.3.3 Europe
5.3.3.1 Germany
5.3.3.2 United Kingdom
5.3.3.3 Italy
5.3.3.4 France
5.3.3.5 Spain
5.3.3.6 Russia
5.3.3.7 Turkey
5.3.3.8 NORDIC Countries
5.3.3.9 Rest of Europe
5.3.4 South America
5.3.4.1 Brazil
5.3.4.2 Argentina
5.3.4.3 Rest of South America
5.3.5 Middle-East and Africa
5.3.5.1 Saudi Arabia
5.3.5.2 South Africa
5.3.5.3 Rest of Middle-East and Africa
6 COMPETITIVE LANDSCAPE
6.1 Mergers and Acquisitions, Joint Ventures, Collaborations, and Agreements