


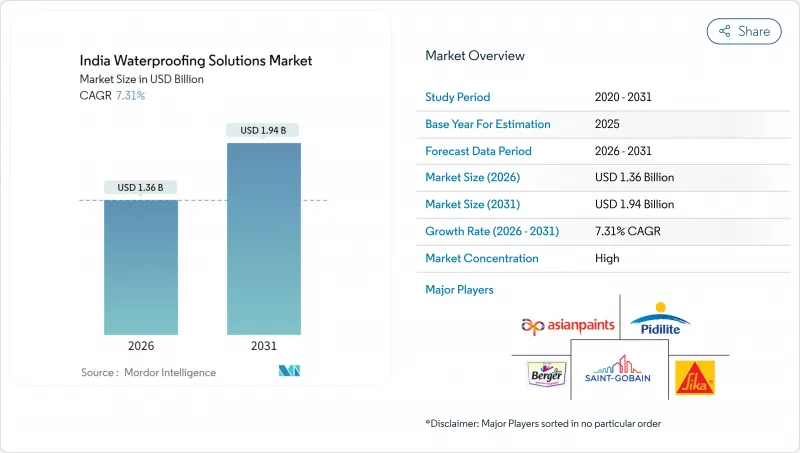
인도의 방수 솔루션 시장은 2025년 12억 7,000만 달러로 평가되었고, 2026년에는 13억 6,000만 달러, 2031년까지 19억 4,000만 달러로 성장할 것으로 예상됩니다. 2026년부터 2031년에 걸쳐 CAGR은 7.31%를 나타낼 전망입니다.

국가 인프라 정비 계획에 근거한 견고한 공공 지출, 기후 변화에 대한 내성을 중시한 건축기준의 엄격화, 예방보전에의 명확한 고객지향의 전환에 의해 원재료 비용의 변동에도 불구하고, 인도의 방수 솔루션 시장은 안정된 성장 궤도를 유지하고 있습니다. 방수 시트는 엄격한 몬순 조건 하에서의 검증된 성능과 개발업자와 부유층의 주택 소유자가 요구하는 장기 보증을 겸비하고 있기 때문에 여전히 주요 기술로 지지되고 있습니다. 주택건설이 프리미엄화를 견인하는 한편, 상업 및 산업·인프라 프로젝트는 열반사 하이브리드 방수시트 등의 선진 시스템에 규모를 가져옵니다. 다각화를 추진하는 도료 대기업과 전문 화학제품 공급업체가 연구개발의 강화, 시공업체 네트워크의 확충, 인도 규격국(BIS)의 개정 방수 사양에의 대응을 겨루는 중, 경쟁은 격화하고 있습니다.
인도에서는 연간 1,000만 명 이상의 도시 주민이 증가하고 있으며, 프라단 맨토리 아와스 요자나(PMAY) 계획만으로도 2025년까지 2,000만 호의 신규 저가 주택 공급을 목표로 하고 있습니다. 개수 공사는 신규 시공의 최대 5배의 비용이 들기 때문에 개발자는 설계 단계에서 예방적 방수를 지정하는 케이스가 증가하고 있습니다. 2024-25년도 예산에서는 기후 변화에 강한 인프라에 1,440억 달러를 계상하고 있으며, 이 조치에 의해 BIS 준거 방수재에의 자금 공급이 직접 연결되고 있습니다. 지하철역, 입체주차장, 복합용도타워 등 지하구조물용 방수시트 수요가 100개 지자체에서 추진되는 스마트시티계획에 의해 증가하고 있습니다. 밀집한 도심부에서의 수직 건설에서는 복잡한 형상에도 피팅 없이 대응하고, 부동침하에 의한 손상 위험이 적은 콜드 액상 방수 시트가 선호되고 있습니다.
방수성과 근적외선 반사성을 겸비한 하이브리드 액체 방수 시트는 여름 피크 시에 옥상 온도를 최대 15℃ 저하시킵니다. 이를 통해 공기조화 에너지 부하를 줄이고 IGBC(인도그린빌딩 평의회)와 LEED(미국환경설계협회)의 인증 포인트 취득에 공헌합니다. 아시아 페인츠와 시카 AG는 인도의 자외선이 강한 기후 내구성과 내변색성 우려에 대응하기 위해 폴리머의 연구개발을 확대하고 있습니다. 조기 도입 사례로는 광대한 지붕 면적에서 에너지 절약 효과가 급속히 누적되는 데이터센터나 제조 공장을 들 수 있습니다. 이 기술은 주택 고층 프로젝트에도 침투하기 시작하고 있으며, 열 취득량의 감소는 중고급층 구매자를 타겟으로 하는 개발자에게 마케팅상의 부가가치가 됩니다. 장기적인 보급 확대에는 현지 원료 조달과 생산량 확대에 의한 제품 비용 절감이 핵심입니다.
전국적으로 방수 시스템의 약 80%는 공식적인 훈련이 제한된 소규모 업체가 시공하고 있으며, 시공 품질의 편차나 조기 고장을 초래하고 있습니다. 도시 지역의 개발자들은 OEM 인증 시공업체의 채택을 의무화하는 경향이 강해지고 있지만, 인도의 광대한 건설 시장에의 침투는 여전히 과제입니다. 제조업체는 지역 연수 센터에 자금을 제공하고 있지만, 노동자가 단기 프로젝트간을 이동하기 때문에 숙련 노동자의 정착율은 낮아지고 있습니다. 단기적으로는 시공 불량이 최종 사용자의 신뢰를 손상시키고, 정밀한 시공을 필요로 하는 고급 방수 시트로의 이행을 늦추고 있습니다.
방수시트는 2025년 시점에서 인도의 방수 솔루션 시장의 65.62%를 차지하고, 2031년까지 연평균 복합 성장률(CAGR)7.46%를 유지해, 요구가 엄격한 용도에 있어서의 기능 기준으로서의 지위를 강화합니다. 상온 액체 도포형 방수 시트는 복잡한 지붕 형상에 피팅가 없는 장벽을 형성하고 토치를 필요로 하지 않고 경화하기 때문에 주택 건설업자에게 지지되고 있습니다. 이것은 현장의 안전성을 향상시킵니다. 전면 접착 시트 시스템은 입증된 20년간의 현장 성능이 중시되는 대규모 상업시설 지붕과 포디움 슬래브로 주류입니다. 고온 액체 도포형은 화학 플랜트나 정유소용이며, 부설식 시트는 조립식 시공을 가능하게 함으로써 신속한 인프라 프로젝트를 지원합니다.
첨단 엘라스토머 화학 기술을 통해 방수 시트는 최대 2mm의 균열을 교차할 수 있으며 변위가 발생하는 고층 구조물에서 결정적인 우위를 발휘합니다. 프리미엄 주택 부문에서는 보증 기간이 12년으로 연장되었으며, 디지털 검사 도구를 통해 제조업체는 보증 적용 전에 시공 감사를 실시할 수 있습니다. 국소적인 보수나 특수 기재용으로는 화학제품이 여전히 중요합니다만, 방수 시트 시장 규모는 규모 확대에 수반하는 제곱미터 단가의 저하에 의해 확대를 계속하고 있습니다. 주요 공급업체의 전략적 원재료 역방향 통합은 원유 가격 변동의 영향으로부터 방수 시트의 가격을 더욱 보호합니다.
인도의 방수 솔루션 보고서는 하위제품별(화학약품 및 방수시트) 및 최종 용도 분야별(상업 및 산업·공공시설, 인프라, 주택)으로 분류되어 있습니다. 시장 예측은 금액 기준(달러)으로 제공됩니다.
The India Waterproofing Solutions Market is expected to grow from USD 1.27 billion in 2025 to USD 1.36 billion in 2026 and is forecast to reach USD 1.94 billion by 2031 at 7.31% CAGR over 2026-2031.
Robust public spending under the National Infrastructure Pipeline, stricter building codes focused on climate resilience, and a clear customer pivot toward preventive maintenance keep the India Waterproofing Solutions market on a stable growth path despite raw-material cost swings. Membranes remain the favored technology because they combine proven performance in aggressive monsoon conditions with the extended warranties demanded by developers and affluent homeowners. Residential construction drives premiumization, while commercial, industrial, and infrastructure projects create scale for advanced systems such as heat-reflective hybrid membranes. Competitive intensity is high as diversified paint majors and specialized chemical suppliers race to improve reseaarch and development, strengthen applicator networks, and comply with the Bureau of Indian Standards' upgraded waterproofing specifications.
India adds more than 10 million urban residents each year, and the Pradhan Mantri Awas Yojana alone targets 20 million new affordable units by 2025. Developers increasingly specify preventive waterproofing at the design stage because retrofits cost up to five times more than original installation. Budget 2024-25 earmarked USD 144 billion for climate-resilient infrastructure, a move that directly links funding to BIS-compliant waterproofing. Smart-City projects in 100 municipalities have elevated demand for membranes that perform in underground metro stations, multilevel parking structures, and mixed-use towers. Vertical construction in dense urban cores favors cold liquid applied membranes, which adapt to complex geometries without joints that could fail under differential settlement.
Hybrid liquid membranes that combine waterproofing with near-infrared reflectance reduce rooftop temperatures by as much as 15 °C during peak summer, lowering HVAC energy loads and helping buildings qualify for IGBC and LEED points. Asian Paints and Sika AG have scaled polymer research and development to address durability and color-fastness concerns in India's ultraviolet-intense climate. Early adopters include data centers and manufacturing plants where energy savings compound quickly across large roof areas. The technology has begun penetrating residential high-rise projects, where reduced heat gain adds marketing value for developers targeting mid-premium buyers. Over the long term, broader rollout depends on lowering product cost through local raw-material sourcing and higher manufacturing volumes.
Small contractors with limited formal training install about 80% of waterproofing systems nationwide, leading to inconsistent workmanship and premature failures.Urban developers increasingly mandate OEM-certified applicators, yet reaching India's sprawling construction market remains challenging. Manufacturers fund regional training centers, but retention of skilled labor is low because workers migrate between short-term projects. In the immediate term, workmanship failures erode end-user confidence and slow the shift toward premium membranes that require meticulous installation.
Other drivers and restraints analyzed in the detailed report include:
For complete list of drivers and restraints, kindly check the Table Of Contents.
Membranes represented 65.62% of the India Waterproofing Solutions market share in 2025 and will maintain a 7.46% CAGR to 2031, reinforcing their status as the functional benchmark for demanding applications. Cold liquid applied membranes attract residential builders because they form seamless barriers over complex roof lines and cure without torches, enhancing job-site safety. Fully adhered sheet systems dominate large-format commercial roofs and podium slabs where proven 20-year field performance matters. Hot liquid variants address chemical plants and refineries, while loose-laid sheets support fast-track infrastructure projects by enabling pre-fabricated installation sequences.
Advanced elastomeric chemistry helps membranes bridge cracks up to 2 mm, a critical advantage in high-rise structures subject to differential movement. Warranties now extend to 12 years in premium residential segments, and digital inspection tools allow manufacturers to audit installations before issuing coverage. While chemicals retain relevance for localized repairs and niche substrates, the India Waterproofing Solutions market size for membranes keeps increasing as cost per square meter falls with scale. Strategic raw-material backward integration by major suppliers further cushions membrane pricing against crude-driven volatility.
The India Waterproofing Solutions Report is Segmented by Sub Product (Chemicals and Membranes), and End-Use Sector (Commercial, Industrial and Institutional, Infrastructure, and Residential). The Market Forecasts are Provided in Terms of Value (USD).