


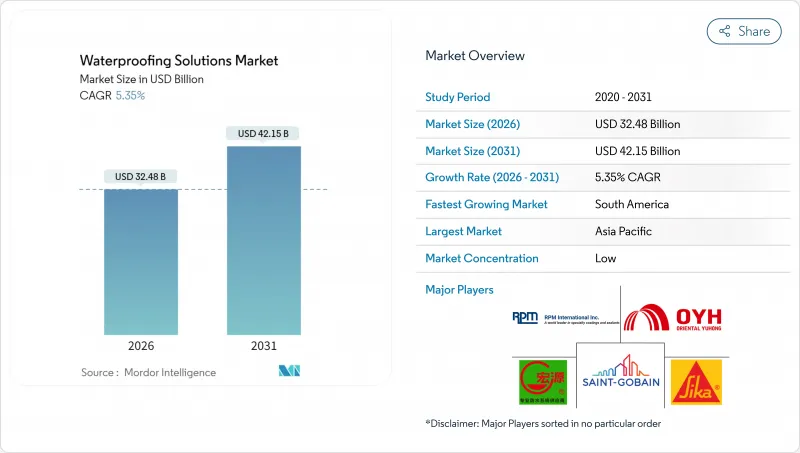
방수 솔루션 시장은 2025년 308억 3,000만 달러로 평가되었고, 2026년에는 324억 8,000만 달러, 2031년까지 421억 5,000만 달러로 성장할 것으로 예상됩니다. 2026년부터 2031년에 걸쳐 CAGR은 5.35%를 나타낼 전망입니다.

현재의 확대는 친환경 빌딩의 의무화, 인프라의 탄력성 목표, 절력화 건설 수법이 결합되어 사후 대응 보수에서 예방적인 건축 외장 보호로의 결정적인 전환을 반영하고 있습니다. 원활하게 경화하고 숙련된 시공자를 보다 적게 필요로 하는 액상 도포형 방수 시트는 신축 및 개수의 양 환경에 있어서, 많은 시트 베이스의 시스템에 옮겨 대체하고 있습니다. 보다 엄격한 VOC 규제로 화학 도료의 수성화 및 바이오 베이스 화학에의 재배합이 가속화되고 있습니다. 또한 공공 부문의 조달은 초기 비용보다 라이프사이클 전체의 성능을 중시하게 되었습니다. 또한 데이터센터의 냉각 강도, 터널 수리 및 기후 적응 프로젝트가 적용 기반을 확대하고 있으며 원재료 가격 변동에도 불구하고 가격 결정력은 상대적으로 안정적입니다.
규제 당국은 현재 많은 방수 카테고리에서 VOC 함유량을 50g/L 이하로 제한하고 있으며, 이에 따라 공공 주택이나 상업 프로젝트에서는 용제계 도료가 사양에서 벗어나는 경향이 있습니다. 첨단 에멀젼 폴리머 기술을 보유한 제조업체는 용제계 방수 시트와 동등 이상의 내구성을 갖춘 수성 방수 시트를 제공함으로써 프리미엄 포지션을 획득하고 있습니다. 시공업자도 현장에서의 냄새 저감에 의해 재입주까지의 기간이 단축되어 작업원의 노출 리스크가 저감되기 때문에 이러한 제품을 채택하고 있습니다. LEED 적합성 및 EU 친환경 라벨 준수를 나타내는 표시는 건축가에게 중요한 구매 판단 자료입니다. 동시에 신흥 바이오 베이스 수지를 통해 기업은 탄소 배출량 감소를 어필할 수 있어 단순한 VOC 규제 준수를 넘어 차별화를 실현하고 있습니다.
아시아와 남미에서는 대도시의 확대에 따라 매년 수백만 평방 피트의 지붕, 포디움, 지하면이 증설되고 있습니다. 대형 댐, 지하철, 홍수 대책 터널에는 지속적인 정수압 하에서도 성능을 발휘하는 특수한 방수 시트가 요구됩니다. 고층 건축에서는 실패의 영향이 크므로 설계 팀은 장기 보증이 적용된 다층 액체 도포 시스템을 지정합니다. 모듈식 조립식 아파트에서는 현장 도착 시 완전히 경화된 공장 도포 방수 코팅이 더욱 선호되어 근무 시간을 줄일 수 있습니다. 정부가 입찰에 기후 변화 저항 조항을 통합하는 동안 랜드마크 인프라의 실적을 가진 공급업체는 입찰 후보 목록에 신속하게 이름을 올리고 있습니다.
에폭시 수지, 폴리우레탄 수지 및 PVC 수지의 원료 가격은 원유 가격의 변동에 연동하며, 이는 분기별로 제품 가격에 영향을 미칩니다. 천연 고무 공급 부족으로 인해 2024년부터 2025년까지 원료 비용이 15-20% 상승하여 제조업체는 재고 헤지 및 신속한 가격 조정 통지 발행을 강요했습니다. 구매력이 한정되는 중소의 배합 제조업체는 공급 확보에 고전해, 통합형 대기업에 시장 점유율을 양도했습니다. 일부 계약자는 가능한 범위에서 시멘트계 페인트로 대체를 진행했지만 성능 차이에서 전반적인 전환은 어렵습니다. 지속적인 가격 변동을 받아 가격 위험을 완화하는 바이오 유래 또는 재생 폴리머의 연구 개발이 촉진되고 있지만, 산업 규모의 생산량은 여전히 초기 단계에 있습니다.
2025년에 있어서의 매출액의 73.42%를 막재가 차지해, 균일한 두께와 신속한 시공을 실현하는 시트·액체 시스템이 방수 솔루션 시장에서 압도적인 쉐어를 유지하고 있는 것을 반영하고 있습니다. 부문별로는 막재가 2031년까지 5.69%라는 최고 수준의 CAGR을 나타낼 것으로 예측되고 있으며, 방수 솔루션 시장 점유율이 꾸준히 확대될 전망입니다. 모듈식 건축의 성장에 따라 콜드 액상 폴리우레탄이 부피 모듈 주위에 피팅가 없는 코팅을 형성하는 수요가 증가하고 있습니다. 고온 스프레이 폴리우레아는 습윤 기후에서도 몇 시간 이내에 교통 재개가 가능한 즉각적인 경화 특성으로부터 토목 구조물로 계속 선호되고 있습니다. 저경사 지붕 분야에서는 ASTM 시험에 의한 확실한 실적을 배경으로 완전 접착 시트가 주도적 지위를 유지. 한편, 뿌리 저항성과 가역층을 필요로 하는 녹화 지붕이나 플라자 데크 설계에서는 느슨한 조립체가 생태학적 틈새를 발견하고 있습니다.
제조업체 각 사는 콘크리트에서 금속이나 열가소성 수지로의 이행을 간소화하기 위해 이종 기재간에 접착하는 프라이머를 개발 중입니다. RFID 태그가 달린 롤을 이용한 통합 품질 보증 플랫폼에서는 로트 번호·도포율·환경 조건 데이터를 기록하여 설계자에게 성능의 일관성을 보장합니다. 한편, ISO 22114 시험에 관한 업계 연계는 국내 규격 간의 결과를 조화시켜 국경을 넘은 프로젝트 승인을 원활하게 하고 있습니다. 전반적으로 방수 시트의 재료 진화와 현장 효율 향상으로 방수 솔루션 시장에서 라이프 사이클 비용을 줄이려는 가치 중심의 소유자에게는 여전히 최적의 선택이되고 있습니다.
아시아태평양은 중국, 인도, 동남아시아의 주택, 고속도로 및 수력 발전 프로젝트의 지속적인 추진으로 2025년 수익의 36.70%라는 압도적인 점유율을 유지했습니다. 대규모 관민 연계 사업이 수량 보증을 지지해, 프로젝트 거점 근처에 지역 창고나 기술 팀을 설치할 수 있는 공급자에게 유리하게 일합니다. 일본과 한국은 엄격한 건축 기준에 따라 고스펙 액체 방수막을 조기에 채택해 신흥 인근국이 추후 추종하는 기준을 확립했습니다. 정부가 방수 공사비를 기후 적응 프로그램에 통합하고 홍수 대책이나 고가 철도 구조물에의 자극책을 유도함으로써 성장이 가속화됩니다.
남미는 2031년까지 6.22%라는 가장 높은 CAGR이 전망되고 있습니다. 브라질이 도시 교통 자금을 재개하고 콜롬비아가 안데스 횡단 터널을 완성하기 때문입니다. 환율 변동은 폴리머 수지의 현지 생산을 촉진하고 다국적 기업에 합작 사업의 기회를 창출하고 있습니다. 아르헨티나의 완만한 회복으로 주택 수요가 축적되고 유통업체는 노동력 부족 현장에 적합한 속 경화 아크릴계 방수 시트의 재고를 늘리고 있습니다. 호우와 강한 자외선이 특징인 지역 기후는 유연성을 유지하는 엘라스토머 시스템을 선호합니다. 정부 입찰에서는 ASTM C836 또는 EN 14891을 필수 기준으로 지정하는 경우가 증가하고 있습니다.
북미와 유럽은 성숙시장에서 저단일 자리수 성장하면서 세계의 기술 동향을 견인하고 있습니다. 미국 인프라 투자 및 고용법에 의해 교량 마루판 오버레이나 빗물 터널에 수십억 달러가 투입되어 고급 공급자에게 견고한 기반이 유지되고 있습니다. 유럽의 녹색 거래는 완전히 재활용 가능하거나 바이오 층으로의 사양 변경을 촉구하고 석유 화학제품을 많이 사용하는 배합에 압력을 가하고 있습니다. 중동 및 아프리카 시장에서는 걸프 지역의 메가 프로젝트에 수요가 집중되어 있으며, 극한의 열이 자외선 안정성 폴리 우레아의 채택을 추진하고 있습니다. 한편, 남아프리카의 도시재생에서는 개발은행의 대출에 의해 저소득자용 주택의 방수공사에 자금이 할당되고 있습니다.
The Waterproofing Solutions market is expected to grow from USD 30.83 billion in 2025 to USD 32.48 billion in 2026 and is forecast to reach USD 42.15 billion by 2031 at 5.35% CAGR over 2026-2031.
The current expansion reflects a decisive pivot from reactive repairs to proactive building-envelope protection, as green-building mandates, infrastructure resilience goals, and labor-saving construction methods converge. Liquid-applied membranes, which cure seamlessly and require fewer skilled installers, are replacing many sheet-based systems in both new-build and retrofit settings. Tighter VOC regulations have accelerated the reformulation of chemical coatings toward water-borne and bio-based chemistries, while public-sector procurement now values total life-cycle performance over initial cost. Finally, data-center cooling intensity, tunnel rehabilitation, and climate-adaptation projects are broadening the application base, keeping pricing power relatively stable despite volatility in raw materials.
Regulators now limit VOC content to 50 g/L or lower for many waterproofing categories, pushing solvent-based coatings off specifications in public housing and commercial projects. Manufacturers with advanced emulsion-polymer chemistry are capturing premium positions by delivering water-based membranes that match or surpass the durability of solvent-borne membranes. Contractors embrace these products because reduced on-site odors shorten re-occupancy cycles and cut worker-exposure risks. Labels indicating LEED-compatible or EU Ecolabel compliance have become critical purchasing cues for architects. In parallel, emerging bio-based resins enable firms to advertise carbon footprint reductions, offering differentiation beyond simple VOC compliance.
Megacity expansion is adding millions of square feet of roof, podium, and below-grade surfaces each year across Asia and South America. Large dams, subways, and flood-control tunnels require specialized membranes that perform under sustained hydrostatic pressure. High-rise construction heightens the consequence of failure, so design teams specify multi-layer liquid-applied systems backed by long warranties. Modular-prefab apartment blocks further favor factory-applied waterproof coatings that arrive onsite fully cured, shrinking labor hours. As governments bundle climate-resilience clauses into tenders, suppliers with track records on landmark infrastructure quickly climb bid shortlists.
Epoxy, polyurethane, and PVC feedstocks track crude oil fluctuations, which in turn affect finished goods prices every quarter. Natural-rubber shortfalls lifted raw-material costs by 15-20% between 2024 and 2025, forcing manufacturers to hedge inventory and issue rapid surcharge notices. Smaller formulators with limited purchasing power struggled to secure supplies, conceding market share to integrated majors. Some contractors substituted cementitious coatings where feasible, but performance gaps limit wholesale migration. Continuous volatility encourages research and development into bio-sourced or recycled polymers to buffer price risk, although industrial-scale volumes remain nascent.
Other drivers and restraints analyzed in the detailed report include:
For complete list of drivers and restraints, kindly check the Table Of Contents.
Membranes accounted for 73.42% of the revenue in 2025, reflecting the waterproofing solutions market share dominance of sheet and liquid systems, which deliver uniform thickness and rapid installation. At the segment level, membranes are projected to command the highest 5.69% CAGR to 2031, meaning their share of the waterproofing solutions market size is forecasted to widen steadily. Demand aligns with the growth of modular buildings, where cold-liquid-applied polyurethanes form seamless skins around volumetric modules. Hot-spray polyureas remain favored on civil structures because instant curing allows traffic reopening within hours, even in humid climates. Fully adhered sheets continue to lead the way in low-slope roofing, thanks to their well-documented ASTM test pedigree, while loose-laid assemblies find ecological niches in green-roof and plaza-deck designs that require root-resistant yet reversible layers.
Manufacturers are engineering primers that bond across dissimilar substrates to simplify transitions from concrete to metal or thermoplastic. Integrated QA platforms using RFID-tagged rolls now log batch, spread-rate, and ambient-condition data, assuring specifiers of performance consistency. Meanwhile, industry collaboration on ISO 22114 testing harmonizes outcomes across domestic codes, easing cross-border project approvals. Overall, membranes' materials evolution and job-site efficiencies keep them the go-to solution for value-driven owners seeking low life-cycle costs within the waterproofing solutions market.
The Global Waterproofing Solutions Market Report is Segmented by Product (Chemicals Including Epoxy-Based, Polyurethane-Based, Water-Based, and Other Technologies; Membranes Including Cold Liquid Applied, Hot Liquid Applied, Fully Adhered Sheet, and Loose-Laid Sheet), End-Use Sector (Commercial, Residential, and More), and Geography (Asia-Pacific, North America, and More). The Market Forecasts are Provided in Terms of Value (USD).
The Asia-Pacific region retained a commanding 36.70% of 2025 revenue as China, India, and Southeast Asia continued to drive housing, expressway, and hydropower projects. Large public-private partnerships underpin volume commitments that reward suppliers who can establish regional warehouses and technical crews near project hubs. Japan and South Korea, with stringent building codes, adopted high-spec liquid membranes early, setting benchmarks that were later emulated in emerging neighbors. Growth accelerates when governments integrate waterproofing line items into broader climate-adaptation programs, channeling stimulus toward flood protection and elevated rail structures.
South America is projected to deliver the strongest 6.22% CAGR through 2031, as Brazil reinstates urban-mobility funding and Colombia completes cross-Andean tunnels. Exchange-rate swings encourage local manufacturing of polymer resins, creating joint-venture openings for multinationals. Argentina's gradual recovery drives pent-up residential demand, prompting distributors to stock fast-curing acrylic membranes suitable for labor-constrained sites. Regional climate, with heavy rainfall and high UV, favors elastomeric systems that stay flexible, and government tenders increasingly list ASTM C836 or EN 14891 as mandatory standards.
North America and Europe exhibit mature, low-single-digit growth, yet set the global technology pace. The U.S. Infrastructure Investment and Jobs Act steers billions into bridge-deck overlays and stormwater tunnels, maintaining a resilient base for premium suppliers. Europe's Green Deal shifts specifications toward fully recyclable or bio-based layers, pressuring petrochemical-heavy formulations. The Middle East and Africa markets concentrate demand in Gulf megaprojects, where extreme heat drives the uptake of UV-stable polyureas. Meanwhile, South Africa's urban renewal allocates funds to low-income housing waterproofing, financed by development banks.