ㅁ Add-on 가능: 고객의 요청에 따라 일정한 범위 내에서 Customization이 가능합니다. 자세한 사항은 문의해 주시기 바랍니다.
ㅁ 보고서에 따라 최신 정보로 업데이트하여 보내드립니다. 배송기일은 문의해 주시기 바랍니다.
한글목차
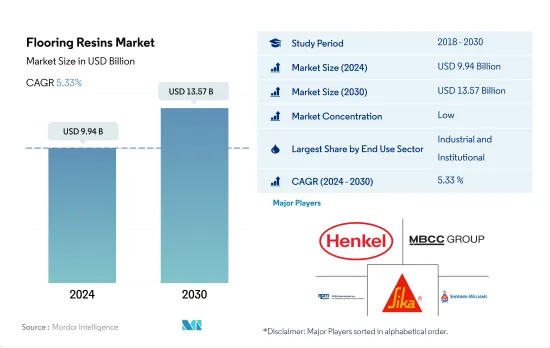
바닥용 수지 시장 규모는 2024년에 99억 4,000만 달러로 평가되었고, 2030년에는 135억 7,000만 달러에 이를 것으로 예측되며, 예측 기간(2024-2030년) 중 CAGR 5.33%로 성장할 전망입니다.
쇼핑몰, 센터, 사무실 수요 증가가 바닥용 수지 수요를 견인할 것 같습니다.
2022년, 세계의 바닥용 수지 소비액은 3.08%의 성장률을 기록했지만, 이것은 산업, 시설 및 상업 건축 부문에서의 수요 증가에 의한 것입니다. 2023년에 바닥용 수지 시장은 세계 건축용 화학제품 시장의 약 11.09%의 성장이 평가되었습니다.
2022년 점유율은 87.89%로 압도적이었으며, 산업 및 시설 분야가 바닥용 수지의 주요 소비자로 부상했습니다. 이 급증은 신규 바닥 면적의 현저한 확대에 기인하고 있습니다. 예를 들어, 세계의 산업용 바닥 면적은 2023년에 비해 2030년까지 20억 1,000만 평방피트 증가할 것으로 예상됩니다. 이 증가의 주요 요인은 산업, 교육 및 헬스케어 건설에 대한 투자 증가입니다. 특히 미국에서는 2026년까지 새로운 산업용 건물에 475억 9,000만 달러를 투자할 것으로 예상됩니다. 그 결과 산업 부문에서 바닥용 수지에 대한 수요는 2023년에 비해 2030년에는 35억 9,000만 달러 증가할 것으로 예측됩니다.
상업 분야는 바닥용 수지 소비의 톱 러너가 될 것으로 보이며, 예측 기간 중의 CAGR은 6.87%로 견조합니다. 세계 상업용 바닥 면적은 특히 개발도상국에서 쇼핑몰, 사무실 및 기타 상업공간 수요 급증에 견인되어 2030년까지 25억 평방피트 확대될 것으로 예상됩니다. 예를 들어 인도네시아에서는 2025년까지 6개의 쇼핑몰 프로젝트가 완성되어 총 면적은 29만 2,000제곱미터에 이를 예정입니다. 이러한 추세에서 상업 부문의 세계 바닥용 수지 수요는 2023년 5억 8,800만 달러에서 2030년에는 9억 3,600만 달러로 증가할 것으로 예측됩니다.
아시아태평양에서 가장 빠르게 성장하는 바닥용 수지 시장을 관리하는 인도 및 일본
2022년 바닥용 수지에 대한 수요는 전년 대비 북미에서 가장 증가했습니다. 이 지역의 2022년 수요는 2021년에 비해 5.74%의 성장을 기록했습니다. 이 동향은 2023년에도 계속된 것으로 평가되었습니다. 따라서 바닥용 수지에 대한 전체 수요는 2023년에는 2022년에 비해 인프라의 최종 사용자 부문에서 가장 증가한 것으로 평가되었습니다.
중국과 인도를 필두로 하는 아시아태평양이 세계의 바닥용 수지 시장을 독점하고 있습니다. 2022년에는 이 두 나라에서만 이 지역 총 수요의 경이로운 77%를 차지했습니다. 아시아태평양에서 바닥용 수지 소비의 주요 원동력은 산업용 및 시설용으로 이어지는 상업용입니다. 특필해야 할 것은 인도에서 예측 기간 2023년부터 2030년까지 CAGR 7.5%로 성장할 것으로 예측되며, 이 지역에서 가장 급성장하는 시장이 될 전망입니다.
유럽은 세계 2위의 바닥용 수지 소비국이며, 이러한 높은 수요에 공헌하고 있는 선진국이 가장 많습니다. 독일은 이 지역에서 가장 광범위한 바닥용 수지 소비국이며, 2022년에는 총 수요의 17% 가까이를 차지했습니다. 에폭시와 폴리우레탄을 기반으로 하는 바닥용 수지는 유럽 포트폴리오의 80% 이상을 차지했습니다.
인도와 일본이 견인하는 아시아태평양은 바닥용 수지 시장에서 가장 급속한 성장을 이루며 예측 기간 2023년부터 2030년까지 CAGR은 6.13%를 나타낼 것으로 예상됩니다. 특히 인도와 일본은 수요의 급증을 기록하고 예측기간 중 CAGR은 각각 7.53%와 7.09%를 나타낼 것으로 예상됩니다.
세계의 바닥용 수지 시장 동향
아시아태평양의 대규모 오피스 빌딩 건설 프로젝트 급증으로 세계 상업 건축용 바닥 면적이 증가할 전망
2022년 세계 상업 건축용 바닥 면적은 전년 대비 0.15%의 소폭 성장이 되었습니다. 유럽은 2030년 이산화탄소 배출 목표에 맞추어 에너지 효율적인 오피스 빌딩을 추진하는 움직임이 원동력이 되고 있습니다. 직원의 사무실 복귀에 따라 유럽 기업은 임대 계약을 재개하고 2022년에는 450만 평방피트의 신규 오피스 건설에 박차를 가했습니다. 이 기세는 2023년에도 계속되어 세계 성장률은 4.26%로 평가되었습니다.
COVID-19의 유행은 노동력과 자재 부족을 일으켜 상업 시설 건설 프로젝트의 취소와 지연을 초래했습니다. 그러나 폐쇄가 완화되고 건설활동이 재개됨에 따라 2021년 세계 상업 시설의 신규 바닥 면적은 11.11% 급증하였고 아시아태평양이 20.98%의 성장률로 선도했습니다.
향후 세계 상업 시설의 신규 바닥 면적의 CAGR은 4.56%가 될 전망입니다. 아시아태평양의 CAGR은 5.16%로 예측되며 다른 지역을 능가할 것으로 예상됩니다. 이 성장의 원동력이 되고 있는 것은 중국, 인도, 한국, 일본에서 상업 시설 건설 프로젝트의 활성화입니다. 특히 베이징, 상하이, 홍콩, 타이베이 등 중국의 주요 도시에서는 A급 사무실 공간 건설이 가속화되고 있습니다. 또한 인도에서는 2023년부터 2025년까지 상위 7개 도시에서 약 2,325만 평방피트에 이르는 약 60개의 쇼핑몰이 오픈할 예정입니다. 아시아태평양 전역의 이러한 노력을 합산하면 2030년까지 상업 시설의 신규 바닥 면적은 2022년 대비 15억 6,000만 평방피트 증가할 것으로 예상됩니다.
세계의 주택 부문을 뒷받침하는 저렴한 주택 계획에 대한 정부 투자 증가로 남미 주택 건설이 가장 빠르게 성장할 것으로 추정됩니다.
2022년 세계 주택 건축의 신규 바닥 면적은 2021년 대비 약 2억 8,900만 평방피트 감소했습니다. 이는 토지 부족, 노동력 부족, 건축자재 가격의 지속 불가능한 급등으로 인한 주택 위기 때문입니다. 이 위기는 아시아태평양에 심각한 영향을 미쳤으며, 2022년 신규 바닥 면적은 2021년 대비 5.39% 감소했습니다. 그러나 2023년에는 2030년까지 30억 명을 수용할 수 있는 저렴한 주택을 새로 건설하기 위한 자금을 조달할 수 있는 정부 투자로, 세계 신규 바닥 면적은 2022년 대비 3.31% 증가한 것으로 평가되어 보다 밝은 전망이 기대됩니다.
COVID-19의 유행은 경기 감속을 일으켜, 그 때문에 많은 주택 건설 프로젝트가 중지 또는 연기되어 2020년 세계의 신규 바닥 면적은 2019년에 비해 4.79% 감소했습니다. 2021년에 규제가 해제되어 주택 프로젝트에 대한 침체된 수요가 해방되면서 신규 바닥 면적은 2020년 대비 11.22% 증가했고, 유럽이 18.28%로 가장 높은 성장세를 보였으며, 남미가 2021년에 2020년 대비 17.36% 증가했습니다.
세계의 주택용 신규 바닥 면적은 예측 기간 동안 CAGR 3.81%로 성장을 지속하고, 남미가 가장 빠른 CAGR 4.05%로 발전할 것으로 예측됩니다. 2023년에 발표된 브라질의 Minha Casa Minha Vida와 같은 계획 및 이니셔티브는 몇 가지 규제 변경과 함께 발표되었고, 정부는 저소득 가구에 저렴한 주택을 제공하기 위해 19억 8,000만 달러의 투자를 계획하고 있습니다.
바닥용 수지 산업 개요
바닥용 수지 시장은 세분화되어 있어 주요 5개사에서 29.36%를 차지하고 있습니다. 이 시장 주요 기업은 다음과 같습니다. Henkel AG & Co. KGaA, MBCC Group, RPM International Inc., Sika AG 및 The Sherwin-Williams Company.
기타 혜택
엑셀 형식 시장 예측(ME) 시트
3개월의 애널리스트 서포트
목차
제1장 주요 요약 및 주요 조사 결과
제2장 보고서 제안
제3장 서문
조사 전제조건 및 시장 정의
조사 범위
조사 방법
제4장 주요 산업 동향
최종 용도 분야의 동향
상업
산업 및 시설
인프라
주택
주요 인프라 프로젝트(현재 및 발표됨)
규제 프레임워크
밸류체인 및 유통채널 분석
제5장 시장 세분화
최종 용도 분야별
상업
산업 및 시설
인프라
주택
서브 제품별
아크릴
에폭시
폴리아스파라틱
폴리우레탄
기타 수지 유형
지역별
아시아태평양
국가별
호주
중국
인도
인도네시아
일본
말레이시아
한국
태국
베트남
기타 아시아태평양
유럽
국가별
프랑스
독일
이탈리아
러시아
스페인
영국
기타 유럽
중동 및 아프리카
국가별
사우디아라비아
아랍에미리트(UAE)
기타 중동 및 아프리카
북미
국가별
캐나다
멕시코
미국
남미
국가별
아르헨티나
브라질
기타 남미
제6장 경쟁 구도
주요 전략 동향
시장 점유율 분석
기업 상황
기업 프로파일
3M
Akzo Nobel NV
Henkel AG & Co. KGaA
KCC Corporation
MBCC Group
Nippon Paint Holdings Co., Ltd.
PPG Industries, Inc.
RPM International Inc.
Sika AG
The Sherwin-Williams Company
제7장 CEO에 대한 주요 전략적 질문
제8장 부록
세계 개요
개요
Porter's Five Forces 분석 프레임워크(산업 매력도 분석)
세계 밸류체인 분석
시장 역학(DROs)
정보원 및 참고문헌
도표 일람
주요 인사이트
데이터 팩
용어집
AJY
영문 목차
영문목차
The Flooring Resins Market size is estimated at 9.94 billion USD in 2024, and is expected to reach 13.57 billion USD by 2030, growing at a CAGR of 5.33% during the forecast period (2024-2030).
Rise in demand for shopping malls and centers and offices is likely to drive the demand for flooring resins
In 2022, the global consumption value of flooring resins registered a 3.08% growth rate, driven by heightened demand from the industrial and institutional and commercial construction sectors. In 2023, the flooring resins market was expected to grow by approximately 11.09% of the global construction chemicals market.
With a dominant share of 87.89% in 2022, the industrial and institutional sector emerged as the leading consumer of flooring resins. This surge can be attributed to a notable expansion in new construction floor areas. For instance, the global industrial floor area is expected to rise by 2.01 billion square feet by 2030 compared to 2023. This uptick is primarily fueled by increased investments in industrial, education, and healthcare construction. Notably, the United States is anticipated to spend a staggering USD 47.59 billion on new industrial buildings by 2026. Consequently, the demand for flooring resins in the industrial sector is projected to rise by USD 3.59 billion in 2030 compared to 2023.
The commercial sector is poised to be the frontrunner in flooring resin consumption, registering a robust CAGR of 6.87% during the forecast period. The global commercial floor area is expected to expand by 2.50 billion square feet by 2030, led by surging demand for shopping malls, offices, and other commercial spaces, particularly in developing nations. For instance, Indonesia is slated to witness the completion of six shopping mall projects, adding up to a total area of 292 thousand square meters by 2025. These trends indicate that the global flooring resin demand in the commercial sector is projected to increase from USD 588 million in 2023 to USD 936 million in 2030.
India and Japan managing the flooring resins market to grow the fastest in the Asia-Pacific region
The demand for flooring resins in 2022 increased the most in North America compared to the previous year. The region registered a 5.74% growth in demand in 2022 compared to 2021. The trend was expected to continue in 2023. Thus, the overall demand for flooring resins was estimated to increase the most in the infrastructure end-user sector in 2023 compared to 2022.
Asia-Pacific, spearheaded by China and India, dominates the global flooring resins market. In 2022, these two nations alone accounted for a staggering 77% of the region's total demand. Commercial usage, following industrial and institutional, is the primary driver of flooring resin consumption in the Asia-Pacific. Notably, India is poised to be the region's fastest-growing market, registering a CAGR of 7.5% during the forecast period (2023-2030).
Europe is the world's second-largest consumer of flooring resins and has the highest number of developed countries contributing to such high demand. Germany is the region's most extensive flooring resins consumer, accounting for nearly 17% of the total demand in 2022. Epoxy and polyurethane-based flooring resins comprise more than 80% of Europe's portfolio.
Asia-Pacific, driven by India and Japan, is expected to witness the most rapid growth in the flooring resins market, registering a CAGR of 6.13% during the forecast period (2023-2030). Specifically, India and Japan are expected to record surging demand, registering CAGRs of 7.53% and 7.09%, respectively, during this period.
Global Flooring Resins Market Trends
Asia-Pacific's surge in large-scale office building projects is set to elevate the global floor area dedicated to commercial construction
In 2022, the global new floor area for commercial construction witnessed a modest growth of 0.15% from the previous year. Europe stood out with a significant surge of 12.70%, driven by a push for high-energy-efficient office buildings to align with its 2030 carbon emission targets. As employees returned to offices, European companies, resuming lease decisions, spurred the construction of 4.5 million square feet of new office space in 2022. This momentum is poised to persist in 2023, with a projected global growth rate of 4.26%.
The COVID-19 pandemic caused labor and material shortages, leading to cancellations and delays in commercial construction projects. However, as lockdowns eased and construction activities resumed, the global new floor area for commercial construction surged by 11.11% in 2021, with Asia-Pacific taking the lead with a growth rate of 20.98%.
Looking ahead, the global new floor area for commercial construction is set to achieve a CAGR of 4.56%. Asia-Pacific is anticipated to outpace other regions, with a projected CAGR of 5.16%. This growth is fueled by a flurry of commercial construction projects in China, India, South Korea, and Japan. Notably, major Chinese cities like Beijing, Shanghai, Hong Kong, and Taipei are gearing up for an uptick in Grade A office space construction. Additionally, India is set to witness the opening of approximately 60 shopping malls, spanning 23.25 million square feet, in its top seven cities between 2023 and 2025. Collectively, these endeavors across Asia-Pacific are expected to add a staggering 1.56 billion square feet to the new floor area for commercial construction by 2030, compared to 2022.
South America's estimated fastest growth in residential constructions due to increasing government investments in schemes for affordable housing to boost the global residential sector
In 2022, the global new floor area for residential construction declined by around 289 million square feet compared to 2021. This can be attributed to the housing crisis generated due to the shortage of land, labor, and unsustainably high construction materials prices. This crisis severely impacted Asia-Pacific, where the new floor area declined 5.39% in 2022 compared to 2021. However, a more positive outlook is expected in 2023 as the global new floor area is predicted to grow by 3.31% compared to 2022, owing to government investments that can finance the construction of new affordable homes capable of accommodating 3 billion people by 2030.
The COVID-19 pandemic caused an economic slowdown, due to which many residential construction projects got canceled or delayed, and the global new floor area declined by 4.79% in 2020 compared to 2019. As the restrictions were lifted in 2021 and pent-up demand for housing projects was released, new floor area grew 11.22% compared to 2020, with Europe having the highest growth of 18.28%, followed by South America, which rose 17.36% in 2021 compared to 2020.
The global new floor area for residential construction is expected to register a CAGR of 3.81% during the forecast period, with South America predicted to develop at the fastest CAGR of 4.05%. Schemes and initiatives like the Minha Casa Minha Vida in Brazil announced in 2023 with a few regulatory changes, for which the government plans an investment of USD 1.98 billion to provide affordable housing units for low-income families, and the FOGAES in Chile also publicized in 2023, with an initial investment of USD 50 million, are aimed at providing mortgage loans to families for affordable housing and will encourage the construction of new residential units.
Flooring Resins Industry Overview
The Flooring Resins Market is fragmented, with the top five companies occupying 29.36%. The major players in this market are Henkel AG & Co. KGaA, MBCC Group, RPM International Inc., Sika AG and The Sherwin-Williams Company (sorted alphabetically).
Additional Benefits:
The market estimate (ME) sheet in Excel format
3 months of analyst support
TABLE OF CONTENTS
1 EXECUTIVE SUMMARY & KEY FINDINGS
2 REPORT OFFERS
3 INTRODUCTION
3.1 Study Assumptions & Market Definition
3.2 Scope of the Study
3.3 Research Methodology
4 KEY INDUSTRY TRENDS
4.1 End Use Sector Trends
4.1.1 Commercial
4.1.2 Industrial and Institutional
4.1.3 Infrastructure
4.1.4 Residential
4.2 Major Infrastructure Projects (current And Announced)
4.3 Regulatory Framework
4.4 Value Chain & Distribution Channel Analysis
5 MARKET SEGMENTATION (includes market size, forecasts up to 2030 and analysis of growth prospects.)
5.1 End Use Sector
5.1.1 Commercial
5.1.2 Industrial and Institutional
5.1.3 Infrastructure
5.1.4 Residential
5.2 Sub Product
5.2.1 Acrylic
5.2.2 Epoxy
5.2.3 Polyaspartic
5.2.4 Polyurethane
5.2.5 Other Resin Types
5.3 Region
5.3.1 Asia-Pacific
5.3.1.1 By Country
5.3.1.1.1 Australia
5.3.1.1.2 China
5.3.1.1.3 India
5.3.1.1.4 Indonesia
5.3.1.1.5 Japan
5.3.1.1.6 Malaysia
5.3.1.1.7 South Korea
5.3.1.1.8 Thailand
5.3.1.1.9 Vietnam
5.3.1.1.10 Rest of Asia-Pacific
5.3.2 Europe
5.3.2.1 By Country
5.3.2.1.1 France
5.3.2.1.2 Germany
5.3.2.1.3 Italy
5.3.2.1.4 Russia
5.3.2.1.5 Spain
5.3.2.1.6 United Kingdom
5.3.2.1.7 Rest of Europe
5.3.3 Middle East and Africa
5.3.3.1 By Country
5.3.3.1.1 Saudi Arabia
5.3.3.1.2 United Arab Emirates
5.3.3.1.3 Rest of Middle East and Africa
5.3.4 North America
5.3.4.1 By Country
5.3.4.1.1 Canada
5.3.4.1.2 Mexico
5.3.4.1.3 United States
5.3.5 South America
5.3.5.1 By Country
5.3.5.1.1 Argentina
5.3.5.1.2 Brazil
5.3.5.1.3 Rest of South America
6 COMPETITIVE LANDSCAPE
6.1 Key Strategic Moves
6.2 Market Share Analysis
6.3 Company Landscape
6.4 Company Profiles
6.4.1 3M
6.4.2 Akzo Nobel N.V.
6.4.3 Henkel AG & Co. KGaA
6.4.4 KCC Corporation
6.4.5 MBCC Group
6.4.6 Nippon Paint Holdings Co., Ltd.
6.4.7 PPG Industries, Inc.
6.4.8 RPM International Inc.
6.4.9 Sika AG
6.4.10 The Sherwin-Williams Company
7 KEY STRATEGIC QUESTIONS FOR CONCRETE, MORTARS AND CONSTRUCTION CHEMICALS CEOS
8 APPENDIX
8.1 Global Overview
8.1.1 Overview
8.1.2 Porter's Five Forces Framework (Industry Attractiveness Analysis)