ㅁ Add-on 가능: 고객의 요청에 따라 일정한 범위 내에서 Customization이 가능합니다. 자세한 사항은 문의해 주시기 바랍니다.
ㅁ 보고서에 따라 최신 정보로 업데이트하여 보내드립니다. 배송기일은 문의해 주시기 바랍니다.
한글목차
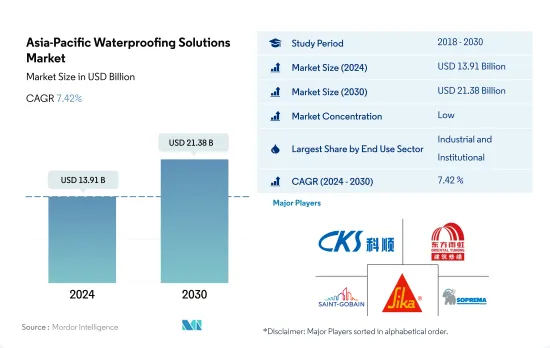
아시아태평양의 방수 솔루션 시장 규모는 2024년 139억 1,000만 달러로 평가되었고, 2030년 213억 8,000만 달러에 이를 것으로 예측되며, 예측 기간(2024-2030년) 중 CAGR 7.42%로 성장할 전망입니다.
주택 수요 증가로 아시아태평양에서는 주택용 최종 용도 부문이 가장 급성장할 것으로 보입니다.
2022년 아시아태평양의 방수 솔루션 소비량은 4.77% 증가하여 산업, 시설, 주택 건설 부문에서의 수요 증가가 견인했습니다. 2023년까지 이 지역은 세계 방수 솔루션 시장의 약 53.32%를 차지한 것으로 평가됩니다.
이 지역의 방수 솔루션 소비는 산업 및 시설 부문이 압도적으로 많아 2022년에는 32.45%를 차지했습니다. 이 부문의 신규 바닥 면적은 2030년까지 11억 6,000만 평방 피트 증가할 전망이며, 2023년부터 크게 증가합니다. 이러한 급증은 도시화 및 산업화 동향에 힘입어 산업, 교육 및 건강 관리 건설에 대한 투자 증가로 인해 발생합니다. 그 결과 방수 솔루션에 대한 이 부문 수요는 2023년에 비해 2030년까지 25억 달러 증가할 것으로 예측됩니다.
이 지역의 주택 부문은 방수 솔루션 소비의 가장 높은 성장을 보여 주며, 예측 기간 동안 CAGR 8.43%로 전망됩입니다. 이 지역의 도시화는 정부의 이니셔티브 및 국내외 투자에 의한 경제 자극과 함께 주택 수요를 견인하고 있습니다. 2030년까지 인도 인구의 40% 이상이 도시에 거주할 것으로 예상되며, 2,500만 호의 저렴한 주택이 추가로 필요합니다. 그 결과 이 지역의 주택 부문을 위한 방수 솔루션 소비량은 2023년 32억 달러에서 2030년 57억 달러로 급증할 것으로 예상됩니다.
중국에서는 주택 건설 프로젝트의 부활과 함께 방수 솔루션에 대한 수요가 높아질 것으로 예측됩니다.
방수 솔루션은 지붕, 벽, 기초, 지하실, 욕실 등 습기와 물에 노출되는 곳에 적용하여 구조물에 물이 침입하거나 손상되지 않도록 막과 화학제품을 포함합니다. 2022년 아시아태평양 방수 솔루션 시장은 2021년에 비해 금액으로 4.77% 성장했으며 호주와 태국 등 국가들이 각각 7.40%, 6.84%로 가장 높은 성장을 이루었습니다. 또한 2023년에는 2022년 대비 6.11% 시장 성장이 평가되었습니다.
중국의 방수 솔루션 시장은 2022년 금액 기준으로 66%의 최대 시장 점유율을 차지했습니다. 이 나라의 모든 최종 용도 분야에서 산업 건설 및 주택 건설은 방수 솔루션 시장을 크게 지배했습니다. 2022년에는 산업 건설이 방수 솔루션의 총 시장 점유율의 28억 달러를 차지했으며, 2023년에는 전년 대비 7.97% 증가한 것으로 더욱 성장할 가능성이 높습니다. 게다가 중국의 방수 솔루션 시장은 2022년부터 2023년까지 금액으로 6.85%의 성장이 전망됩니다.
중국의 방수 솔루션 시장은 예측 기간 동안 금액으로 가장 빠른 CAGR 7.72%를 나타낼 것으로 예측됩니다. 이 나라에서는 2030년까지 주택 건설의 신규 바닥 면적이 2022년 대비 약 23억 5,000만 평방피트 증가할 것으로 예측되고 있습니다. 이 배경에는 모기지 융자 차입 금리 인하, 계약금 지불 요건 인하, 주택 구매에 대한 규제 완화가 있습니다. 그 결과 중국 주택 건설용 방수 솔루션 시장은 예측 기간 동안 금액 기준으로 가장 빠른 CAGR 8.58%로 성장할 것으로 예상됩니다.
아시아태평양의 방수 솔루션 시장 동향
인도 등에서 소매점과 사무실 공간이 증가하여, 아시아태평양의 상업 건설 분야를 뒷받침
2022년 아시아태평양 상업 시설의 신규 바닥 면적은 전년 대비 3.23% 감소했습니다. 이 후퇴는 규제의 압력, 인플레이션율의 상승, 모기지 금리 급상승 등의 요인에 의한 것입니다. 2023년에는 이 지역이 회복되었고 상업 시설의 신규 바닥 면적은 약 1억 4,600만 평방 피트 증가했습니다. 이 급증은 주로 외국 직접투자(FDI) 증가로 인한 것으로, 새로운 오피스, 창고, 소매점, 기타 시설 수요에 박차를 가했습니다. 특히 베트남 건설 부문은 2023년 7,144만 달러의 FDI 자본을 유치했습니다.
2020년 아시아태평양은 상업 시설의 신규 바닥 면적에서 대폭적인 후퇴를 경험해 2019년 대비 21.92%의 수량 감소가 되었습니다. 이 감소의 주요 원인은 정부의 봉쇄가 확산되고 프로젝트 작업이 중단되었으며 공급망, 장비 및 노동력에 심각한 영향을 미쳤다는 것입니다. 그러나 규제가 완화됨에 따라 이 지역은 눈부신 회복을 보였으며 2021년 상업 시설의 신규 바닥 면적은 20.98% 급증하여 약 5억 2,600만 평방 피트의 바닥 면적에 이르렀습니다.
아시아태평양의 상업용 신규 바닥 면적은 크게 성장할 것으로 예상되며, 2023년에 비해 2030년에는 14억 1,000만 평방 피트 증가할 것으로 추정됩니다. 이러한 급증은 쇼핑몰, 오피스 스페이스, 소매점 등에 대한 수요 증가에 뒷받침되고 있습니다. 아시아태평양은 세계 소매 대국으로 부상하고 있으며 세계 소매 성장의 4분의 3에 기여하고 있습니다. 예를 들어, 인도의 등급 A 오피스 시장은 상위 7개 도시에서 2026년까지 10억 평방 피트, 2030년까지 12억 평방 피트로 확장될 수 있습니다. 전반적으로 아시아태평양 상업 시설의 신규 바닥 면적은 예측 기간 동안 CAGR 5.16%를 나타낼 것으로 예상됩니다.
인도에서는 2030년까지 2,500만 호에 달할 가능성이 있는 등 저렴한 주택이 증가하여, 이 지역 주택 건설이 확대될 전망입니다.
2022년 아시아태평양 주택 착공 바닥 면적은 전년 대비 약 5.39% 감소했습니다. 이 침체는 COVID-19의 대유행 시 건축 활동이 급증한 후 분야가 정상화된 결과입니다. 이 지역의 주택 부문은 인구 증가, 부유층 증가 및 급속한 도시화에 의해 견인되고 있습니다. 이 지역의 주택 신축상 면적은 2023년에는 2022년 대비 4억 1,000만 평방 피트 증가한 것으로 평가되었습니다.
2020년 아시아태평양 주택 신규 바닥 면적은 2019년 대비 약 5.06% 감소했습니다. 이는 주로 정부의 봉쇄, 공급망 혼란, 노동력 부족, 건설 생산성 저하, 외국 투자 침체로 인한 것이었습니다. 그러나 규제가 완화됨에 따라 이 지역에서는 상당한 회복이 보였고, 2021년에는 주택 신설 호수 증가로 주택 신규 바닥 면적이 약 14억 평방 피트 급증했습니다. 예를 들어, 2021년에만 인도의 주택 부동산 시장은 상위 7개 도시에서 약 16만 3,000개의 신축 주택을 도입했습니다.
아시아태평양의 주택 신축 바닥 면적은 예측 기간 동안 CAGR 3.98%를 나타낼 것으로 예측됩니다. 이 성장은 주택 수요, 투자 증가, 유리한 정부 정책 때문입니다. 보다 저렴한 주택 건설에 주력함으로써 이 지역의 주택건설 부문은 활기를 되찾아 회복에 도움이 될 것으로 기대됩니다. 2030년까지는 인도 인구의 40% 이상이 도시에 거주할 것으로 예상되며, 2,500만 호의 저렴한 주택 수요가 예상됩니다. 이 수요가 급증함에 따라 인도의 주택 부동산 시장은 2030년까지 150만 호에 달할 것으로 예상됩니다.
아시아태평양의 방수 솔루션 산업 개요
아시아태평양의 방수 솔루션 시장은 단편화되어 상위 5개사에서 21.44%를 차지하고 있습니다. 이 시장 주요 기업은 다음과 같습니다. Keshun Waterproof Technology, Oriental Yuhong, Saint-Gobain, Sika AG 및 Soprema.
기타 혜택
엑셀 형식 시장 예측(ME) 시트
3개월간의 애널리스트 서포트
목차
제1장 주요 요약 및 주요 조사 결과
제2장 보고서 제안
제3장 서문
조사 전제조건 및 시장 정의
조사 범위
조사 방법
제4장 주요 산업 동향
최종 용도 분야의 동향
상업
산업 및 시설
인프라
주택
주요 인프라 프로젝트(현재 및 발표됨)
규제 프레임워크
밸류체인 및 유통채널 분석
제5장 시장 세분화
최종 용도 분야별
상업
산업 및 시설
인프라
주택
서브 제품별
화학제품
기술별
에폭시계
폴리우레탄계
수성
기타 기술
멤브레인
기술별
콜드 리퀴드
완전 접착 시트
핫 리퀴드
루즈 레이드 시트
국가별
호주
중국
인도
인도네시아
일본
말레이시아
한국
태국
베트남
기타 아시아태평양
제6장 경쟁 구도
주요 전략 동향
시장 점유율 분석
기업 상황
기업 프로파일
Ardex Group
Fosroc, Inc.
Hongyuan Waterproof Technology Group Co., Ltd.
Keshun Waterproof Technology Co., ltd.
Lonseal Corporation
MBCC Group
Oriental Yuhong
Saint-Gobain
Sika AG
Soprema
제7장 CEO에 대한 주요 전략적 질문
제8장 부록
세계 개요
개요
Porter's Five Forces 분석 프레임워크(산업 매력도 분석)
세계 밸류체인 분석
시장 역학(DROs)
정보원 및 참고문헌
도표 일람
주요 인사이트
데이터 팩
용어집
AJY
영문 목차
영문목차
The Asia-Pacific Waterproofing Solutions Market size is estimated at 13.91 billion USD in 2024, and is expected to reach 21.38 billion USD by 2030, growing at a CAGR of 7.42% during the forecast period (2024-2030).
Growing demand for housing units is likely to make the residential end-use sector the fastest growing in Asia-Pacific
In 2022, the Asia-Pacific region witnessed a 4.77% growth in the consumption of waterproofing solutions, driven by rising demand from the industrial, institutional, and residential construction sectors. By 2023, the region is projected to capture approximately 53.32% of the global waterproofing solutions market.
The industrial and institutional sector dominates the region's waterproofing solutions consumption, accounting for 32.45% in 2022. This sector's new floor area is set to rise by 1.16 billion square feet by 2030, a significant increase from 2023. This surge is attributed to heightened investments in industrial, education, and healthcare construction, bolstered by urbanization and industrialization trends. Consequently, the sector's demand for waterproofing solutions is projected to rise by USD 2.5 billion by 2030, compared to 2023.
The residential sector in the region is poised to witness the highest growth in waterproofing solutions consumption, with a CAGR of 8.43% during the forecast period. The region's urbanization, coupled with economic stimuli from government initiatives and both foreign and domestic investments, is driving the demand for housing. By 2030, it is projected that over 40% of India's population will reside in urban areas, necessitating around 25 million additional affordable housing units. Consequently, the region's waterproofing solutions consumption for the residential sector is anticipated to surge from USD 3.2 billion in 2023 to USD 5.7 billion in 2030.
High demand is forecasted for waterproofing solutions in China, followed by the revival of residential construction projects
Waterproofing solutions include membranes and chemicals that prevent water from penetrating or damaging a structure when applied to roofs, walls, foundations, basements, bathrooms, and other areas exposed to moisture or water. In 2022, the Asia-Pacific waterproofing solutions market grew by 4.77% in value compared to 2021, with countries like Australia and Thailand having the highest growth of 7.40% and 6.84%, respectively. Furthermore, in 2023, the market was projected to grow by 6.11% in value compared to 2022.
China's waterproofing solutions market accounted for the largest market share of 66% by value in 2022. Among all end-use sectors in the country, industrial and residential construction significantly dominated the waterproofing solutions market. In 2022, industrial construction occupied USD 2.8 billion of the gross market share for waterproofing solutions and was likely to grow further in 2023 by 7.97% in value compared to the previous year. Moreover, the Chinese waterproofing solutions market was anticipated to grow by 6.85% in value from 2022 to 2023.
The Chinese waterproofing solutions market is estimated to register the fastest CAGR of 7.72% in value during the forecast period. The country is projected to witness an increase of about 2.35 billion sq. ft in the new floor area for residential construction by 2030 compared to 2022. This can be attributed to the lowering of mortgage borrowing rates, down-payment requirements, and relaxed restrictions on home purchases. As a result, the Chinese waterproofing solutions market for residential construction is expected to grow at the fastest CAGR of 8.58% in value during the forecast period.
Rising retail and office spaces in countries such as India to boost the Asia-Pacific commercial construction sector
In 2022, Asia-Pacific witnessed a 3.23% decline in its commercial new floor area compared to the previous year. This setback was attributed to factors such as regulatory pressures, higher inflation, and a surge in mortgage rates. In 2023, the region rebounded, with commercial construction new floor area increasing by approximately 146 million sq. ft. This surge was primarily driven by a rise in foreign direct investment (FDI), which spurred the demand for new offices, warehouses, retail outlets, and other facilities. Notably, the Vietnamese construction sector attracted an FDI capital of USD 71.44 million in 2023.
In 2020, the Asia-Pacific region experienced a significant setback in commercial new floor area, with a volume decline of 21.92% compared to 2019. This decline was primarily due to widespread government lockdowns, which disrupted project work and severely impacted supply chains, equipment, and labor. However, as restrictions eased, the region witnessed a remarkable rebound, with its commercial new floor area surging by 20.98% in 2021, reaching a volume of approximately 526 million sq. ft.
Asia-Pacific's commercial new floor area is projected to witness substantial growth, with an estimated increase of 1.41 billion sq. ft by 2030 compared to 2023. This surge is fueled by a rising demand for shopping malls, office spaces, retail outlets, and more. The Asia-Pacific region is emerging as a global retail powerhouse, contributing to nearly three-quarters of the worldwide retail growth. For instance, the Indian Grade A office market in its top seven cities may to expand to 1 billion sq. ft by 2026 and further to 1.2 billion sq. ft. by 2030. Overall, the commercial new floor area in Asia-Pacific is projected to witness a volume CAGR of 5.16% during the forecast period.
Rising affordable housing units, such as India's likely to reach 25 million by 2030, to augment the residential constructions in the region
In 2022, the residential new floor area in the Asia-Pacific region saw a volume decline of approximately 5.39% from the previous year. This dip was a result of the sector normalizing after a surge in building activity during the COVID-19 pandemic. The region's residential sector is driven by a growing population, increasing wealth, and rapid urbanization. The residential new floor area in the region was expected to rise by 410 million sq. ft in 2023 compared to 2022.
In 2020, the residential new floor area in Asia-Pacific declined in volume by around 5.06% compared to 2019. This was primarily due to government-imposed lockdowns, disruptions in the supply chain, labor shortages, reduced construction productivity, and low foreign investments. However, as restrictions eased, the region saw a significant rebound, with the residential new floor area surging by about 1.4 billion sq. ft in 2021, driven by the addition of new residential housing units. For instance, in 2021 alone, the Indian residential real estate market introduced approximately 163 thousand new residential units across its top seven cities.
The residential new floor area in the Asia-Pacific region is projected to witness a CAGR of 3.98% during the forecast period. This growth can be attributed to the demand for housing, increased investments, and favorable government policies. The focus on constructing more affordable housing units is expected to rejuvenate the residential construction sector in the region, aiding its recovery. By 2030, it is estimated that over 40% of India's population will reside in urban areas, leading to a demand for an additional 25 million affordable housing units. This surge in demand is expected to push the Indian residential real estate market to reach 1.5 million units by 2030.
Asia-Pacific Waterproofing Solutions Industry Overview
The Asia-Pacific Waterproofing Solutions Market is fragmented, with the top five companies occupying 21.44%. The major players in this market are Keshun Waterproof Technology Co., ltd., Oriental Yuhong, Saint-Gobain, Sika AG and Soprema (sorted alphabetically).
Additional Benefits:
The market estimate (ME) sheet in Excel format
3 months of analyst support
TABLE OF CONTENTS
1 EXECUTIVE SUMMARY & KEY FINDINGS
2 REPORT OFFERS
3 INTRODUCTION
3.1 Study Assumptions & Market Definition
3.2 Scope of the Study
3.3 Research Methodology
4 KEY INDUSTRY TRENDS
4.1 End Use Sector Trends
4.1.1 Commercial
4.1.2 Industrial and Institutional
4.1.3 Infrastructure
4.1.4 Residential
4.2 Major Infrastructure Projects (current And Announced)
4.3 Regulatory Framework
4.4 Value Chain & Distribution Channel Analysis
5 MARKET SEGMENTATION (includes market size, forecasts up to 2030 and analysis of growth prospects.)
5.1 End Use Sector
5.1.1 Commercial
5.1.2 Industrial and Institutional
5.1.3 Infrastructure
5.1.4 Residential
5.2 Sub Product
5.2.1 Chemicals
5.2.1.1 By Technology
5.2.1.1.1 Epoxy-based
5.2.1.1.2 Polyurethane-based
5.2.1.1.3 Water-based
5.2.1.1.4 Other Technologies
5.2.2 Membranes
5.2.2.1 By Technology
5.2.2.1.1 Cold Liquid Applied
5.2.2.1.2 Fully Adhered Sheet
5.2.2.1.3 Hot Liquid Applied
5.2.2.1.4 Loose Laid Sheet
5.3 Country
5.3.1 Australia
5.3.2 China
5.3.3 India
5.3.4 Indonesia
5.3.5 Japan
5.3.6 Malaysia
5.3.7 South Korea
5.3.8 Thailand
5.3.9 Vietnam
5.3.10 Rest of Asia-Pacific
6 COMPETITIVE LANDSCAPE
6.1 Key Strategic Moves
6.2 Market Share Analysis
6.3 Company Landscape
6.4 Company Profiles
6.4.1 Ardex Group
6.4.2 Fosroc, Inc.
6.4.3 Hongyuan Waterproof Technology Group Co., Ltd.
6.4.4 Keshun Waterproof Technology Co., ltd.
6.4.5 Lonseal Corporation
6.4.6 MBCC Group
6.4.7 Oriental Yuhong
6.4.8 Saint-Gobain
6.4.9 Sika AG
6.4.10 Soprema
7 KEY STRATEGIC QUESTIONS FOR CONCRETE, MORTARS AND CONSTRUCTION CHEMICALS CEOS
8 APPENDIX
8.1 Global Overview
8.1.1 Overview
8.1.2 Porter's Five Forces Framework (Industry Attractiveness Analysis)