남미의 전기 버스용 배터리 팩 시장 : 점유율 분석, 산업 동향 및 통계, 성장 예측(2023-2029년)
South America Electric Bus Battery Pack - Market Share Analysis, Industry Trends & Statistics, Growth Forecasts (2023 - 2029)
상품코드:1683882
리서치사:Mordor Intelligence
발행일:2025년 03월
페이지 정보:영문
라이선스 & 가격 (부가세 별도)
ㅁ Add-on 가능: 고객의 요청에 따라 일정한 범위 내에서 Customization이 가능합니다. 자세한 사항은 문의해 주시기 바랍니다.
ㅁ 보고서에 따라 최신 정보로 업데이트하여 보내드립니다. 배송기일은 문의해 주시기 바랍니다.
한글목차
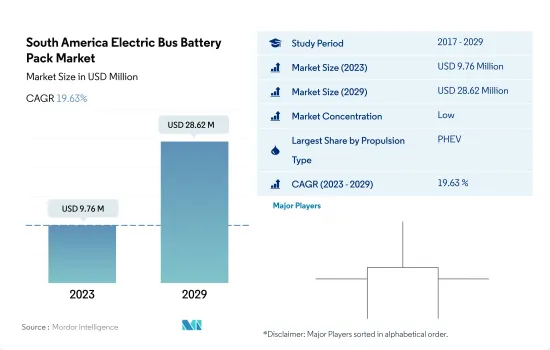
남미의 전기 버스용 배터리 팩 시장 규모는 2023년에 976만 달러로 추정됐고, 2029년에는 2,862만 달러에 이를 것으로 예측되며, 예측 기간 중(2023-2029년) CAGR 19.63%로 성장할 것으로 예측됩니다.
남미 지역의 많은 국가에서 버스는 대중 교통의 주요 수단 중 하나입니다. 기존의 오래된 버스는 ICE 엔진에 더 많은 이산화탄소를 배출하기 때문에 최근 브라질, 칠레, 콜롬비아 등 남미 국가에서 전기 버스 수요가 점차 높아지고 있습니다.
전기 버스는이 지역의 나라에서 점차 증가하고 있습니다. 남미에서는 2022년 현재 칠레가 다양한 유형의 전기 버스와 이를 이동하기 위한 배터리 팩 수요가 가장 높은 국가 중 하나입니다. 칠레는 800대 이상의 버스를 보유하고 있으며 배터리 시장에 크게 기여하고 있습니다.
다양한 기업들이 이 지역의 여러 나라에서 전기 버스 주문을 받고 있습니다. 2022년 11월 중국 자동차 제조업체 BYD는 2023년 전반까지 브라질 상파울루에서 100대의 전기 버스 섀시를 납품한다고 발표했습니다. 이 섀시는 전기 버스에 추가로 조립되어 배터리 전기 버스 및 PHEB와 같은 다양한 유형의 버스에 대한 배터리 팩에 대한 수요도 증가합니다. 이러한 개발로 남미에서는 예측기간 동안 배터리팩 수요가 높아질 것으로 예상됩니다.
남미 전기 버스용 배터리 팩 시장 동향
수요 증가와 정부 인센티브가 남미 전기차 시장 견인
브라질과 아르헨티나 등 남미 지역에 속한 여러 나라들은 자동차 시장에 큰 잠재력을 지니고 있으며, 남미 자동차 산업은 지난 몇 년간 상당한 성장을 이루고 있습니다. 최근, 이 지역에서는 전기자동차에 대한 의식이 높아지고, 환경에 대한 관심이 높아지고, 전기자동차의 도입을 향한 정부의 뒷받침 등의 요인에 의해 승용차를 중심으로 한 전기자동차 수요가 증가하고 있습니다. 이러한 요인에 의해 소비자는 서서히 전기차로 시프트하고 있으며, 2022년의 전기차 판매 대수는 2021년 대비 17.95%로 증가하고 있습니다.
남미에는 다양한 잠재적인 전기자동차 시장이 있으며, 브라질은 신재생에너지 발전의 도입에 주력하고 있기 때문에 전기버스의 잠재적인 수요가 있습니다. 게다가 2022년 12월 상파울루는 디젤버스 구매를 금지하고 2024년 말까지 2,600대의 전기버스를 배포한다고 발표했습니다. 기타 국가에서도 유사한 요인이 있으며, 예측 기간 동안 남미에서 자동차의 전기화가 촉진 될 것으로 예상됩니다.
남미의 자동차 전동화는 이 지역의 각국 정부가 실시하는 정책이나 인센티브 프로그램에 의해 촉진될 것으로 예상됩니다. 콜롬비아 정부는 이산화탄소 배출 문제에 대처하기 위해 2030년까지 60만대의 EV를 달리게 하는 야심적인 목표를 달성하기 위해 인센티브와 보조금을 활용하고 있으며 세제상의 우대조치가 주된 동기가 되고 있습니다. 그 결과, 남미의 기타 국가에서도 유사한 요인으로 예측 기간 동안 EV 판매가 증가할 것으로 예상됩니다.
기타 혜택
엑셀 형식 시장 예측(ME) 시트
3개월의 애널리스트 서포트
목차
제1장 주요 요약과 주요 조사 결과
제2장 보고서 제안
제3장 소개
조사의 전제조건과 시장 정의
조사 범위
조사 방법
제4장 주요 산업 동향
전기 버스 판매 대수
OEM별 전기 버스 판매 대수
판매 LINE EV 모델
선호되는 배터리 화학을 가진 OEM
배터리 팩 가격
배터리 재료 비용
각 배터리 화학의 가격표
누가 누구에게 공급하는지
EV 배터리의 용량과 효율
EV의 발매 모델수
규제 프레임워크
밸류체인과 유통채널 분석
제5장 시장 세분화
추진 유형
BEV
PHEV
배터리 케미스트리
LFP
NCA
NCM
NMC
기타
용량
15-40 kWh
40-80 kWh
80kWh 이상
15kWh 미만
배터리 형상
원통형
파우치
각형
방식
레이저
와이어
컴포넌트
애노드
캐소드
전해액
세퍼레이터
재료 유형
코발트
리튬
망간
천연 흑연
니켈
기타 재료
제6장 경쟁 구도
주요 전략적 움직임
시장 점유율 분석
기업 상황
기업 프로파일
제7장 CEO에 대한 주요 전략적 질문
제8장 부록
세계 개요
개요
Porter's Five Forces 분석 프레임워크
세계의 밸류체인 분석
시장 역학(DROs)
정보원과 참고문헌
도표 일람
주요 인사이트
데이터 팩
용어집
JHS
영문 목차
영문목차
The South America Electric Bus Battery Pack Market size is estimated at 9.76 million USD in 2023, and is expected to reach 28.62 million USD by 2029, growing at a CAGR of 19.63% during the forecast period (2023-2029).
In many of the countries falling under the South America region, buses are one of the main modes of public transit. Old traditional buses emit a lot of carbon dioxide due to ICE engines, therefore during the recent years, demand for electric buses has gradually grown in various South American countries such as Brazil, Chile, colombia etc.
Electric buses are gradually increasing in countries under the region. As of 2022 in South America, Chile has one of the highest demands of various type of electric buses and battery packs to power them. Chile has more than 800 buses being the major contributor to the battery market, some of the other countries such as Brazil, Colombia, Peru is also contributing to the growth of battery packs owing to the growing demand for electric buses in these countries gradaully.
Various companies are getting orders of electric buses from different countries falling under the region. In November 2022, the Chinese automaker BYD has announced to deliver 100 electric buses chassis in Sap Paulo, Brazil by the 1st half of 2023. These chassis will be further assembled to electric buses, which will also increase the demand of the battery packs for various types of buses such as battery electric and PHEB. Such developments are expected to enhance the demand for the battery packs during the forecast period in South America.
South America Electric Bus Battery Pack Market Trends
Growing Demand and Government Incentives Drive Electric Vehicle Market in South America
Various countries falling under the South America region such as Brazil and Argentina etc. have great potential for the automobile market, and the South American vehicle industry has experienced substantial growth over the past few years. In recent years, the demand for electric vehicles, primarily passenger cars, has increased in the region owing to the factors such as rising awareness of electric vehicles, growing environmental concern, governmental push towards the adoption of electric vehicles. These factors are gradually shifting consumers to electric vehicles and the sales of the EVs have grown to 17.95% in 2022 over 2021.
South America has various potential electric vehicle markets and Brazil holds potential demand for electric buses as the country is focusing on the adoption of more renewable power generation, which may utilize the country's large niobium and lithium reserves, a crucial factor for EV batteries' development. Moreover, In December, 2022, Sao Paulo bans the purchasing of diesel buses and has announced to deploy 2600 electric buses by the end of 2024. Similar factors in other countries are expected to boost the electrification of vehicles in the South America during the forecast period.
The electrification of vehicles in South America is anticipated to be fueled by the policies and incentive programs implemented by the governments of the various countries in the region. Tax benefits are the main motivation, as the Government of Colombia is using incentives and subsidies to reach an ambitious goal of 600,000 EVs on the road by 2030 to address the carbon emission issues. As a result, similar factors in other countries in South America is anticipated to increase the sales of the EVs during the forecast period.
Additional Benefits:
The market estimate (ME) sheet in Excel format
3 months of analyst support
TABLE OF CONTENTS
1 EXECUTIVE SUMMARY & KEY FINDINGS
2 REPORT OFFERS
3 INTRODUCTION
3.1 Study Assumptions & Market Definition
3.2 Scope of the Study
3.3 Research Methodology
4 KEY INDUSTRY TRENDS
4.1 Electric Bus Sales
4.2 Electric Bus Sales By OEMs
4.3 Best-Selling EV Models
4.4 OEMs With Preferable Battery Chemistry
4.5 Battery Pack Price
4.6 Battery Material Cost
4.7 Price Chart Of Different Battery Chemistry
4.8 Who Supply Whom
4.9 EV Battery Capacity And Efficiency
4.10 Number Of EV Models Launched
4.11 Regulatory Framework
4.12 Value Chain & Distribution Channel Analysis
5 MARKET SEGMENTATION (includes market size in Value in USD and Volume, Forecasts up to 2029 and analysis of growth prospects)
5.1 Propulsion Type
5.1.1 BEV
5.1.2 PHEV
5.2 Battery Chemistry
5.2.1 LFP
5.2.2 NCA
5.2.3 NCM
5.2.4 NMC
5.2.5 Others
5.3 Capacity
5.3.1 15 kWh to 40 kWh
5.3.2 40 kWh to 80 kWh
5.3.3 Above 80 kWh
5.3.4 Less than 15 kWh
5.4 Battery Form
5.4.1 Cylindrical
5.4.2 Pouch
5.4.3 Prismatic
5.5 Method
5.5.1 Laser
5.5.2 Wire
5.6 Component
5.6.1 Anode
5.6.2 Cathode
5.6.3 Electrolyte
5.6.4 Separator
5.7 Material Type
5.7.1 Cobalt
5.7.2 Lithium
5.7.3 Manganese
5.7.4 Natural Graphite
5.7.5 Nickel
5.7.6 Other Materials
6 COMPETITIVE LANDSCAPE
6.1 Key Strategic Moves
6.2 Market Share Analysis
6.3 Company Landscape
6.4 Company Profiles
7 KEY STRATEGIC QUESTIONS FOR EV BATTERY PACK CEOS