ㅁ Add-on 가능: 고객의 요청에 따라 일정한 범위 내에서 Customization이 가능합니다. 자세한 사항은 문의해 주시기 바랍니다.
ㅁ 보고서에 따라 최신 정보로 업데이트하여 보내드립니다. 배송기일은 문의해 주시기 바랍니다.
한글목차
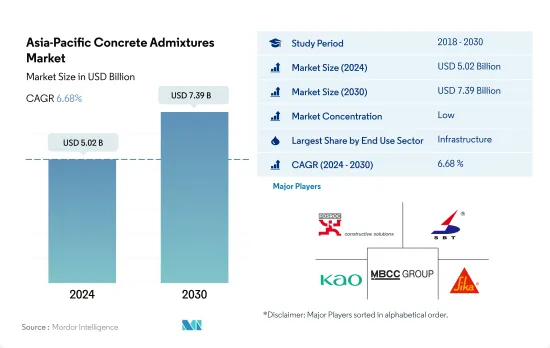
아시아태평양의 콘크리트 혼화제 시장 규모는 2024년 50억 2,000만 달러로, 2030년에는 73억 9,000만 달러에 이를 것으로 예측되며, 예측 기간 중(2024-2030년) CAGR 6.68%로 성장할 전망입니다.
인프라 투자 증가가 콘크리트 혼화제 수요를 견인할 전망
아시아태평양의 콘크리트 혼화제 소비액은 인프라와 주택 건설 부문에서의 수요 증가로 2023년에는 전년 대비 5.35%의 성장이 예상됐습니다. 2022년 아시아태평양의 콘크리트 혼화제는 세계 콘크리트 혼화제 시장의 약 33%를 차지했습니다.
이 지역에서는 인프라 부문이 콘크리트 혼화제의 최대 소비자였으며 2022년에는 약 35%를 차지했습니다. 이 지역에서는 인프라 프로젝트에 대한 투자가 증가하고 있으며 인프라 부문 수요를 견인할 것으로 예측됩니다. 예를 들어 인도는 2030년까지 인프라 개발에 약 4조 5,000억 달러를 투자할 의향입니다. 이 지역의 인프라 지출은 2023년에 비해 2030년에는 2,400억 달러 증가할 것으로 예측됩니다. 그 결과, 이 부문의 콘크리트 혼화제는 2023년 대비 2030년 57.47% 성장할 것으로 예측됩니다.
이 지역의 주택 부문은 콘크리트 혼화제의 소비자로서 가장 급성장하고 있으며, 예측 기간 중 CAGR은 7.84%로 가장 높을 것으로 예상됩니다. 도시화의 진전과 정부의 대처나 국내외의 투자에 의한 경기 부양이, 이 지역의 주택 수요를 직접적·간접적으로 밀어 올리고 있어, 장기적으로는 주택 건설이 증가하게 됩니다. 예를 들어 인도네시아 정부(GOI)는 2025년까지 약 100만 호의 주택 건설을 계획하고 있으며, 이 나라의 주택 수요는 3,000만 호에 달할 것으로 추정됩니다. 그 결과 이 지역의 콘크리트 혼화제는 2023년 13억 9,000만 달러에서 2030년에는 23억 6,000만 달러에 이를 것으로 예측됩니다.
인도네시아에서는 메가 건설 프로젝트가 있기 때문에 콘크리트 혼화제 수요가 높아질 것으로 예상됩니다.
감수제, 공기 오염제, 지연제, 촉진제, 초가소제와 같은 콘크리트 혼화제는 혼합 전 또는 혼합 중에 콘크리트에 첨가되어 그 특성을 변경합니다. 2022년 아시아태평양의 콘크리트 혼화제 시장은 2021년에 비해 금액으로 2.97% 감소했습니다. 중국의 콘크리트 혼화제는 아시아태평양 국가 중 최악의 타격을 받았으며 2021년부터 2022년까지 금액으로 6.99% 감소했습니다. 이는 정부의 COVID 제로 정책이 새로운 봉쇄를 일으키고 건설 프로젝트를 중단시켰기 때문입니다. 이와는 대조적으로 호주 콘크리트 혼화제 시장은 2021년부터 2022년까지 금액으로는 22.53%의 최고 성장을 기록하고, 2022년부터 2023년까지도 이 나라의 콘크리트 혼화제 시장은 금액으로 7.54%의 성장이 예상됐습니다.
중국의 콘크리트 혼화제 시장은 2022년 금액 기준으로 67%의 최대 시장 점유율을 차지했습니다. 콘크리트 혼화제의 모든 최종 용도 분야 중, 인프라 건설만이 2021년부터 2022년까지 금액으로 7.42%의 성장을 기록했으며, 이것은 대중교통 인프라에 대한 지출이 2021년 1,576억 달러에서 2022년 1,656억 달러로 증가했기 때문입니다.
인도네시아의 콘크리트 혼화제 시장은 예측 기간 동안 금액으로 7.06%로 가장 빠른 CAGR을 나타낼 것으로 추정됩니다. 인도네시아 정부는 건설 부문의 성장을 가속하고 콘크리트 혼화제의 사용을 증가시킬 수 있는 수많은 메가 건설 프로젝트를 발표하고 있습니다. 여기에는 2045년까지 자카르타에서 보르네오 섬으로 자본을 이전하는 320억 달러의 계획이 포함되며, 이는 여러 주택, 제조 시설, 발전소, 인프라 등의 건설을 포함합니다.
아시아태평양의 콘크리트 혼화제 시장 동향
인도 등에서 소매점과 사무실 공간이 증가하고 아시아태평양의 상업 건설 분야를 밀어 올립니다.
2022년 아시아태평양 상업시설의 신설 바닥 면적은 전년 대비 3.23% 감소했습니다. 이 후퇴는 규제의 압력, 인플레이션율의 상승, 모기지 금리의 급상승 등의 요인에 의한 것입니다. 2023년에는 이 지역이 회복되었고 상업시설의 신설 바닥 면적은 약 1억 4,600만 평방 피트 증가했습니다. 이 급증은 주로 외국 직접투자(FDI) 증가로 인한 것으로, 새로운 사무실, 창고, 소매점, 기타 시설 수요에 박차를 가했습니다. 특히 베트남 건설 부문은 2023년 7,144만 달러의 FDI 자본을 유치했습니다.
2020년 아시아태평양은 상업시설의 신설 바닥 면적에서 상당한 후퇴를 경험했으며 2019년 대비 21.92%의 수량 감소를 경험했습니다. 이 감소의 주요 원인은 정부의 봉쇄가 확산되고 프로젝트 작업이 중단되었으며 공급망, 장비 및 노동력에 심각한 영향을 미쳤다는 것입니다. 그러나 규제가 완화됨에 따라 이 지역은 눈부신 회복을 보였으며 2021년 상업시설의 신설 바닥 면적은 20.98% 급증하여 약 5억 2,600만 평방 피트의 바닥 면적에 이르렀습니다.
아시아태평양의 상업용 신설 바닥 면적은 크게 성장할 것으로 예상되며, 2023년에 비해 2030년에는 14억 1,000만 평방 피트 증가할 것으로 추정됩니다. 이러한 급증은 쇼핑몰, 사무공간, 소매점 등에 대한 수요 증가에 힘입어지고 있습니다. 아시아태평양은 세계 소매 대국으로 부상하고 있으며 세계 소매 성장의 4분의 3을 기여하고 있습니다. 예를 들어, 인도의 A등급 사무실 시장은 상위 7개 도시에서 2026년까지 10억 평방 피트, 2030년까지 12억 평방 피트로 확장될 수 있습니다. 전반적으로 아시아태평양 상업시설의 신설 바닥 면적은 예측 기간 동안 CAGR 5.16%를 나타낼 것으로 예상됩니다.
인도에서는 2030년까지 2,500만호에 달할 가능성이 있는 등 저렴한 주택이 증가하고, 이 지역의 주택 건설이 확대됩니다.
2022년 아시아태평양의 주택 착공 바닥 면적은 전년 대비 약 5.39% 감소했습니다. 이것은 COVID-19의 대유행 시 건축 활동이 급증한 후 섹터가 정상화된 결과입니다. 이 지역의 주택 부문은 인구 증가, 부유층 증가 및 급속한 도시화에 의해 견인되고 있습니다. 이 지역의 주택 신축상 면적은 2023년에는 2022년 대비 4억 1,000만 평방 피트 증가할 것으로 예상되었습니다.
2020년 아시아태평양의 주택 신설 바닥 면적은 2019년 대비 약 5.06% 감소했습니다. 이는 주로 정부의 봉쇄, 공급망 혼란, 노동력 부족, 건설 생산성 저하, 외국 투자 침체로 인한 것이었습니다. 그러나 규제가 완화됨에 따라 이 지역에서는 상당한 회복이 보였고, 2021년에는 주택 신설 호수 증가로 주택 신설 바닥 면적이 약 14억 평방 피트 급증했습니다. 예를 들어, 인도의 주택 부동산 시장은 2021년에만 상위 7개 도시에서 약 16만 3,000개의 신축 주택을 도입했습니다.
아시아태평양의 주택 신축 바닥 면적은 예측 기간 동안 CAGR 3.98%를 나타낼 것으로 예측됩니다. 이 성장은 주택 수요, 투자 증가, 유리한 정부 정책 때문입니다. 보다 저렴한 주택건설에 주력함으로써 이 지역의 주택건설 부문은 활기를 되찾고 회복할 것으로 예상됩니다. 2030년까지는 인도 인구의 40% 이상이 도시에 거주할 것으로 예상되며, 2,500만 호의 저렴한 주택 수요가 예상됩니다. 이 수요가 급증함에 따라 인도의 주거용 부동산 시장은 2030년까지 150만 호에 달할 것으로 예상됩니다.
아시아태평양의 콘크리트 혼화제 산업 개요
아시아태평양의 콘크리트 혼화제 시장은 세분화되어 상위 5개사에서 29.49%를 차지하고 있습니다. 이 시장 주요 기업은 다음과 같습니다. Fosroc, Inc., Jiangsu Subote New Material Co., Ltd., Kao Corporation, MBCC Group, Sika AG(알파벳순).
기타 혜택
엑셀 형식 시장 예측(ME) 시트
3개월의 애널리스트 서포트
목차
제1장 주요 요약과 주요 조사 결과
제2장 보고서 제안
제3장 소개
조사의 전제조건과 시장 정의
조사 범위
조사 방법
제4장 주요 산업 동향
최종 용도 섹터의 동향
상업
산업·시설
인프라
주택
주요 인프라 프로젝트(현재 및 발표됨)
규제 프레임워크
밸류체인과 유통채널 분석
제5장 시장 세분화(시장 규모, 2030년까지의 예측, 성장 전망 분석 포함)
최종 용도 섹터
상업
산업·시설
인프라
주택
서브제품
촉진제
공기혼입혼화제
고성능 감수제(초가소제)
억제제
수축 저감 혼화제
점도 조정제
감수제(가소제)
기타 유형
국가
호주
중국
인도
인도네시아
일본
말레이시아
한국
태국
베트남
기타 아시아태평양
제6장 경쟁 구도
주요 전략 동향
시장 점유율 분석
기업 상황
기업 프로파일
Cementaid International Group of Companies
Fosroc, Inc.
Guangdong Redwall New Materials Co.,Ltd
Jiangsu Subote New Material Co., Ltd.
Kao Corporation
MAPEI SpA
MBCC Group
MC-Bauchemie
Saint-Gobain
Sika AG
제7장 CEO에 대한 주요 전략적 질문
제8장 부록
세계 개요
개요
Porter's Five Forces 분석 프레임워크(산업 매력도 분석)
세계의 밸류체인 분석
시장 역학(DROs)
정보원과 참고문헌
도표 일람
주요 인사이트
데이터 팩
용어집
JHS
영문 목차
영문목차
The Asia-Pacific Concrete Admixtures Market size is estimated at 5.02 billion USD in 2024, and is expected to reach 7.39 billion USD by 2030, growing at a CAGR of 6.68% during the forecast period (2024-2030).
The rise in infrastructure investment is expected to drive the demand for concrete admixtures
The consumption value of concrete admixtures in Asia-Pacific was expected to witness a growth of 5.35% by value in 2023 compared to the previous year due to increasing demand from infrastructure and residential construction sectors. In 2022, Asia-Pacific's concrete admixtures accounted for around 33% of the global concrete admixtures market.
The infrastructure sector is the region's largest consumer of concrete admixtures, which accounted for around 35% in 2022. The increase in investment for infrastructure projects in the region is projected to drive the demand for the infrastructure sector. For instance, India intends to invest around USD 4.5 trillion in infrastructure development by 2030. The infrastructure spending in the region is projected to increase by USD 240 billion in 2030 compared to 2023. As a result, the concrete admixtures for the sector are projected to grow by 57.47% in 2030 compared to 2023.
The region's residential sector is expected to be the fastest-growing consumer of concrete admixtures, with the highest CAGR of 7.84% during the forecast period. The growing urbanization and economic boost from government initiatives and foreign and domestic investments are directly and indirectly pushing the region's housing needs, which would increase residential building construction in the long run. For instance, the Government of Indonesia (GOI) intends to construct around 1 million housing units by 2025, with the country's housing requirements estimated to reach 30 million units. As a result, the region's concrete admixtures for the sector are projected to reach USD 2.36 billion by 2030 from USD 1.39 billion in 2023.
The demand for concrete admixtures is expected to be high in Indonesia owing to the country's mega-construction projects
Concrete admixtures, such as water reducers, air entrainers, retarders, accelerators, and superplasticizers, are added to concrete before or during mixing to modify its properties. In 2022, the Asia-Pacific concrete admixtures market declined by 2.97% in value compared to 2021. The concrete admixtures in China took the worst hit among all Asia-Pacific countries and fell by 6.99% in value from 2021 to 2022. This can be attributed to the government's zero COVID policy that imposed fresh lockdowns and halted construction projects. In contrast, the Australian concrete admixtures market recorded the highest growth of 22.53% in value from 2021 to 2022, which was expected to continue as the country's concrete admixtures market was expected to grow by 7.54% in value from 2022 to 2023.
China's concrete admixtures market accounted for the largest market share of 67% by value in 2022. Among all end-use sectors for concrete admixtures, only infrastructure construction recorded a positive growth of 7.42% in value from 2021 to 2022, owing to the country's expenditure on public transport infrastructure, which reached USD 165.6 billion in 2022 compared to USD 157.6 billion in 2021.
Indonesia's concrete admixtures market is estimated to register the fastest CAGR of 7.06% in value during the forecast period. The government of Indonesia has announced numerous mega-construction projects that will likely promote the growth of the construction sector and increase the utilization of concrete admixtures in the country. This includes the USD 32 billion plan to relocate the country's capital city from Jakarta to Borneo Island by 2045, which involves the construction of several residential units, manufacturing facilities, power plants, infrastructure, etc.
Asia-Pacific Concrete Admixtures Market Trends
Rising retail and office spaces in countries such as India to boost the Asia-Pacific commercial construction sector
In 2022, Asia-Pacific witnessed a 3.23% decline in its commercial new floor area compared to the previous year. This setback was attributed to factors such as regulatory pressures, higher inflation, and a surge in mortgage rates. In 2023, the region rebounded, with commercial construction new floor area increasing by approximately 146 million sq. ft. This surge was primarily driven by a rise in foreign direct investment (FDI), which spurred the demand for new offices, warehouses, retail outlets, and other facilities. Notably, the Vietnamese construction sector attracted an FDI capital of USD 71.44 million in 2023.
In 2020, the Asia-Pacific region experienced a significant setback in commercial new floor area, with a volume decline of 21.92% compared to 2019. This decline was primarily due to widespread government lockdowns, which disrupted project work and severely impacted supply chains, equipment, and labor. However, as restrictions eased, the region witnessed a remarkable rebound, with its commercial new floor area surging by 20.98% in 2021, reaching a volume of approximately 526 million sq. ft.
Asia-Pacific's commercial new floor area is projected to witness substantial growth, with an estimated increase of 1.41 billion sq. ft by 2030 compared to 2023. This surge is fueled by a rising demand for shopping malls, office spaces, retail outlets, and more. The Asia-Pacific region is emerging as a global retail powerhouse, contributing to nearly three-quarters of the worldwide retail growth. For instance, the Indian Grade A office market in its top seven cities may to expand to 1 billion sq. ft by 2026 and further to 1.2 billion sq. ft. by 2030. Overall, the commercial new floor area in Asia-Pacific is projected to witness a volume CAGR of 5.16% during the forecast period.
Rising affordable housing units, such as India's likely to reach 25 million by 2030, to augment the residential constructions in the region
In 2022, the residential new floor area in the Asia-Pacific region saw a volume decline of approximately 5.39% from the previous year. This dip was a result of the sector normalizing after a surge in building activity during the COVID-19 pandemic. The region's residential sector is driven by a growing population, increasing wealth, and rapid urbanization. The residential new floor area in the region was expected to rise by 410 million sq. ft in 2023 compared to 2022.
In 2020, the residential new floor area in Asia-Pacific declined in volume by around 5.06% compared to 2019. This was primarily due to government-imposed lockdowns, disruptions in the supply chain, labor shortages, reduced construction productivity, and low foreign investments. However, as restrictions eased, the region saw a significant rebound, with the residential new floor area surging by about 1.4 billion sq. ft in 2021, driven by the addition of new residential housing units. For instance, in 2021 alone, the Indian residential real estate market introduced approximately 163 thousand new residential units across its top seven cities.
The residential new floor area in the Asia-Pacific region is projected to witness a CAGR of 3.98% during the forecast period. This growth can be attributed to the demand for housing, increased investments, and favorable government policies. The focus on constructing more affordable housing units is expected to rejuvenate the residential construction sector in the region, aiding its recovery. By 2030, it is estimated that over 40% of India's population will reside in urban areas, leading to a demand for an additional 25 million affordable housing units. This surge in demand is expected to push the Indian residential real estate market to reach 1.5 million units by 2030.
Asia-Pacific Concrete Admixtures Industry Overview
The Asia-Pacific Concrete Admixtures Market is fragmented, with the top five companies occupying 29.49%. The major players in this market are Fosroc, Inc., Jiangsu Subote New Material Co., Ltd., Kao Corporation, MBCC Group and Sika AG (sorted alphabetically).
Additional Benefits:
The market estimate (ME) sheet in Excel format
3 months of analyst support
TABLE OF CONTENTS
1 EXECUTIVE SUMMARY & KEY FINDINGS
2 REPORT OFFERS
3 INTRODUCTION
3.1 Study Assumptions & Market Definition
3.2 Scope of the Study
3.3 Research Methodology
4 KEY INDUSTRY TRENDS
4.1 End Use Sector Trends
4.1.1 Commercial
4.1.2 Industrial and Institutional
4.1.3 Infrastructure
4.1.4 Residential
4.2 Major Infrastructure Projects (current And Announced)
4.3 Regulatory Framework
4.4 Value Chain & Distribution Channel Analysis
5 MARKET SEGMENTATION (includes market size, forecasts up to 2030 and analysis of growth prospects.)
5.1 End Use Sector
5.1.1 Commercial
5.1.2 Industrial and Institutional
5.1.3 Infrastructure
5.1.4 Residential
5.2 Sub Product
5.2.1 Accelerator
5.2.2 Air Entraining Admixture
5.2.3 High Range Water Reducer (Super Plasticizer)
5.2.4 Retarder
5.2.5 Shrinkage Reducing Admixture
5.2.6 Viscosity Modifier
5.2.7 Water Reducer (Plasticizer)
5.2.8 Other Types
5.3 Country
5.3.1 Australia
5.3.2 China
5.3.3 India
5.3.4 Indonesia
5.3.5 Japan
5.3.6 Malaysia
5.3.7 South Korea
5.3.8 Thailand
5.3.9 Vietnam
5.3.10 Rest of Asia-Pacific
6 COMPETITIVE LANDSCAPE
6.1 Key Strategic Moves
6.2 Market Share Analysis
6.3 Company Landscape
6.4 Company Profiles
6.4.1 Cementaid International Group of Companies
6.4.2 Fosroc, Inc.
6.4.3 Guangdong Redwall New Materials Co.,Ltd
6.4.4 Jiangsu Subote New Material Co., Ltd.
6.4.5 Kao Corporation
6.4.6 MAPEI S.p.A.
6.4.7 MBCC Group
6.4.8 MC-Bauchemie
6.4.9 Saint-Gobain
6.4.10 Sika AG
7 KEY STRATEGIC QUESTIONS FOR CONCRETE, MORTARS AND CONSTRUCTION CHEMICALS CEOS
8 APPENDIX
8.1 Global Overview
8.1.1 Overview
8.1.2 Porter's Five Forces Framework (Industry Attractiveness Analysis)