ㅁ Add-on 가능: 고객의 요청에 따라 일정한 범위 내에서 Customization이 가능합니다. 자세한 사항은 문의해 주시기 바랍니다.
ㅁ 보고서에 따라 최신 정보로 업데이트하여 보내드립니다. 배송기일은 문의해 주시기 바랍니다.
한글목차
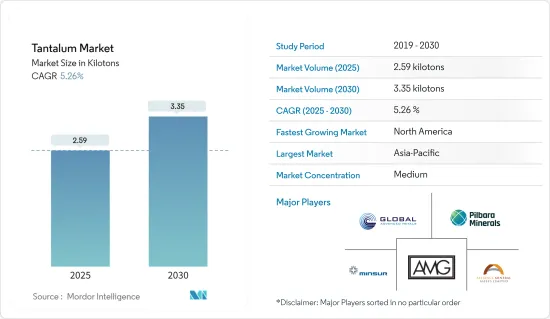
탄탈룸 시장 규모는 2025년에 2.59킬로톤으로 추정됩니다. 예측기간(2025-2030년)의 CAGR은 5.26%로, 2030년에는 3.35킬로톤에 달할 것으로 예측되고 있습니다.
COVID-19의 대유행은 최종 사용자 산업이 큰 영향을 받았기 때문에 세계적으로 탄탈룸 시장에 타격을 주었습니다. 그러나 전기 부문의 성장은 산업에서 개선되고 있으며 시장 개척을 지원합니다. 탄탈룸 시장은 유행에서 회복되고 크게 성장하고 있습니다.
주요 하이라이트
단기적으로는 전기 및 전자산업의 성장과 항공·가스터빈에서의 탄탈룸합금의 광범위한 사용이 예측기간을 통해 시장성장을 가속할 것으로 예측됩니다.
고체 커패시터를 고분자 탄탈룸 커패시터로 대체하는 것은 조사된 시장에서 호기 역할을 할 것으로 예상됩니다.
반면, 탄탈룸의 유해성과 최종 사용자 산업 수요 감소는 시장 성장을 방해하고 있습니다.
아시아태평양은 세계 시장을 독점하고 있으며 중국과 한국 등 국가에서 가장 많이 소비됩니다.
탄탈룸 시장 동향
커패시터 부문이 큰 점유율을 차지할 것으로 예상
탄탈룸 전해 커패시터는 양극 재료로서 탄탈룸(Ta) 금속을 사용하고 있어, 양극 구조의 차이에 의해 호일 유형과 탄탈룸 분말 소결 유형으로 나눌 수 있습니다. 탄탈룸 분말 소결 탄탈룸 커패시터 중에서도 전해질의 차이에 따라 고체 전해질과 비 고체 전해질의 탄탈룸 커패시터가 있습니다. 탄탈룸 전해 커패시터의 외부 껍질에는 CA로 표시되지만 회로의 기호는 다른 전해 커패시터와 동일합니다.
탄탈룸 전해 커패시터는 통신, 컴퓨터, 항공우주, 군사, 첨단 전자 시스템, 휴대용 디지털 제품 등의 부문에서 널리 사용됩니다.
탄탈룸 전해 커패시터는 매우 미세한 탄탈룸 분말로 만들어지고, 탄탈룸 산화 피막의 유전율은 알루미나 산화 피막의 유전율보다 높기 때문에 단위 부피당 정전 용량이 큽니다.
탄탈룸 전해 커패시터는 -50--100℃의 온도에서 정상적으로 동작합니다. 알루미늄 전해 커패시터는 이 범위에서 동작할 수 있지만, 전기적 성능은 탄탈룸 전해 커패시터만큼 좋지 않습니다.
탄탈룸 전해 커패시터의 산화 탄탈룸 피막은 내식성이 우수할 뿐만 아니라 장기간에 걸쳐 양호한 성능을 유지합니다.
전자정보기술산업협회(JEITA)에 따르면 2021년 세계의 컴퓨터·정보 단말기기 수출액은 3,780억 9,700만엔(약 28억 6,295만 달러)에 달하고, 성장률은 106.5% 이는 향후 수년에 한층 더 성장할 것으로 예상되어, 그에 의해 탄탈룸 시장 수요가 높아지고 있다
또한 ZVEI에 따르면 2022년 세계의 소비자용 전자기기 시장은 5%의 성장이 전망되고 있습니다. 2022년에는 조명 부문이 다시 6% 증가한 1,385억 유로(약 1,470억 8,000만 달러)로 약간 높은 성장을 이루는 반면, 소비자용 전자기기(2,874억 유로(약 3,052억 달러))와 소비자용 전자기기 제품(2,687억 유로(약 2,853억 4,000만 달러))은 각각 5% 증가할 수 있습니다. 이러한 성장은 소비자 전자기기 용도으로부터의 탄탈룸 기반 커패시터 수요를 증가시킬 것으로 예상됩니다.
아시아태평양이 시장을 독점
아시아태평양은 중국과 한국과 같은 국가의 소비 증가로 탄탈룸 소비를 위한 주요 시장이었습니다. 전자기기, 항공우주, 의료기기 등의 최종 사용자 산업에서의 수요 증가가 주로 이 지역을 견인하고 있습니다.
중국은 세계 탄탈룸의 주요 소비국 중 하나입니다. 그 산업에서의 수요가 증가함에 따라, 조사된 시장은 향후 수년간 중국에서 성장할 것으로 예상됩니다. 중국은 세계 최대의 전자 기기 생산 기지입니다. 스마트폰, TV, 전선, 케이블, 휴대용 컴퓨팅 장치, 게임 시스템, 기타 개인 장치 등의 전자 제품은 전자 분야에서 가장 높은 성장을 기록했습니다. 중국은 전자제품의 국내 수요에 부응할 뿐만 아니라 전자제품 생산물을 타국에 수출하고 있으며, 세계 유수의 각종 부품 제조업체이기도 합니다.
중국은 가장 큰 항공기 제조업체 중 하나이며 국내 항공 여객 시장에서도 가장 큰 시장 중 하나입니다. 이 나라의 민간 항공기 보유 수는 지난 5년간 꾸준히 증가하고 있습니다. 또한 중국 항공사는 향후 20년간 약 7690대의 항공기 신규 구매를 계획하고 있으며, 그 평가액은 약 1조 2,000억 달러에 이릅니다. 보잉은 중국 국내 평균 RPK(Revenue Passenger Kilometer) 성장률이 향후 10년간 연률 6.1%로 증가할 것으로 추정하고 있습니다. 따라서 커패시터 및 엔진 터빈 블레이드의 항공우주 용도에 대한 수요가 증가하고 있으며 조사 대상 시장 수요를 더욱 높일 것으로 예상됩니다.
인도는 2025년까지 디지털 경제가 1조 달러에 달할 것으로 예상되고 있으며, 인도의 전자 시스템 설계 및 제조(ESDM) 부문은 2025년까지 1,000억 달러 이상의 경제 가치를 창출할 것으로 기대됩니다. Make in India, National Policy of Electronics, Net Zero Imports in Electronics, Zero Defect Zero Effect 등 몇 가지 조치는 국내 제조업 성장, 수입 의존도 저하, 수출 및 제조업 활성화에 대한 헌신을 제시합니다.
정부는 인도에서 전자제품 생산을 촉진하기 위해 생산연동장려금(Production Linked Incentive: PLI)과 함께 전자부품 및 반도체 제조촉진 방식(Promotion of Manufacturing of Electronic Components and Semiconductors: SPECS)과 개량형 전자제품 제조 클러스터(EMC 2.0) 체계라는 새로운 체계를 시작했습니다. PLI 계획에 따르면 정부는 제조업체가 인도에서 생산을 늘리면 5년 동안 55억 달러의 인센티브를 제공하는 것으로 보입니다. 이는 인도에서 전자기기 생산을 촉진할 가능성이 높습니다.
한국은 또한 아시아태평양에서 중요한 수출 경제국 중 하나입니다. 한국의 전자제품 산업은 생산량으로 세계 3위, 소비량으로 세계 5위입니다. 2021년, 전자 제품은 2,007억 9,000만 달러로 평가됩니다.
탄탈룸 산업 개요
탄탈룸 시장은 탄탈룸 채굴 기업이라는 점에서 부분적으로 통합됩니다. 주요 기업으로는 Global Advanced Metals Pty Ltd, AMG Advanced Metallurgical Group NV, Pilbara Minerals, Alliance Mineral Assets Limited, Minsur(Mining Taboca) 등이 있습니다.
기타 혜택
엑셀 형식 시장 예측(ME) 시트
3개월간의 애널리스트 서포트
목차
제1장 서론
조사의 전제조건
조사 범위
제2장 조사 방법
제3장 주요 요약
제4장 시장 역학
성장 촉진요인
전기 및 전자 산업에서의 수요 증가
항공 및 가스 터빈에 탄탈룸 합금의 사용 확대
성장 억제요인
탄탈룸의 유해한 영향과 최종 사용자 산업에서의 수요 감소
기타 억제요인
산업 밸류체인 분석
Porter's Five Forces 분석
공급기업의 협상력
소비자의 협상력
신규 진입업자의 위협
대체품의 위협
경쟁도
수출입 동향
기술 스냅샷
가격지수
규제 시책 분석
제5장 시장 세분화(규모별)
제품
금속
탄화물
분말
합금
기타 제품 형태
용도
커패시터
반도체
엔진 터빈 블레이드
화학처리장치
의료기기
기타 용도(탄도, 절삭 공구, 광학 용도 포함)
지역
생산 분석
미국
호주
브라질
중국
콩고
에티오피아
나이지리아
르완다
기타 국가
소비 분석
아시아태평양
중국
인도
일본
한국
기타 아시아태평양
북미
미국
캐나다
멕시코
유럽
독일
영국
이탈리아
프랑스
기타 유럽
남미
브라질
아르헨티나
기타 남미
중동 및 아프리카
사우디아라비아
기타 중동 및 아프리카
제6장 경쟁 구도
인수합병, 합작사업, 제휴, 협정
시장 점유율(%)**/랭킹 분석
주요 기업의 전략
기업 프로파일(개요, 재무, 제품 및 서비스, 최근 동향)
AMG Advanced Metallurgical Group NV
Alliance Mineral Assets Limited
China Minmetals Corporation
CNMC Ningxia Orient Group Co. Ltd
Ethiopian Mineral Development Share Company
Global Advanced Metals Pty Ltd
Jiangxi Tungsten Industry Group Co. Ltd
Minsur(Mining Taboca)
Pilbara Minerals
Piran Resources Limited(Pella Resources Limited)
Tantalex Resources Corporation
Tantec GmbH
Techmet(KEMET GROUP)
Taniobis GmbH
제7장 시장 기회와 앞으로의 동향
고체 커패시터에서 폴리머 탄탈룸 커패시터로 교체
기타 기회
KTH
영문 목차
영문목차
The Tantalum Market size is estimated at 2.59 kilotons in 2025, and is expected to reach 3.35 kilotons by 2030, at a CAGR of 5.26% during the forecast period (2025-2030).
The COVID-19 pandemic hurt the tantalum market globally as end-user industries were significantly affected. However, growth in the electrical segment is improving in the industry, which will assist the market development. The tantalum market has recovered from the pandemic and is growing significantly.
Key Highlights
Over the short term, the growth of the electrical and electronic industry and the extensive usage of tantalum alloys in aviation and gas turbines are projected to fuel market growth throughout the forecast period.
Replacing solid capacitors with polymer tantalum capacitors is expected to act as an opportunity for the studied market.
On the flip side, the harmful effects of tantalum and the decrease in demand from end-user industries are hindering the market's growth.
Asia-Pacific dominates the market across the world, with the largest consumption from countries such as China and South Korea.
Tantalum Market Trends
Capacitor Segment is Anticipated to Hold a Significant Share
A tantalum electrolytic capacitor is made of tantalum (Ta) metal as anode material, which can be divided into foil and tantalum powder sintered types according to different anode structures. Among tantalum powder sintered tantalum capacitors, there are tantalum capacitors with solid and non-solid electrolytes due to different electrolytes. The shell of tantalum electrolytic capacitors is marked with CA, but the symbol in the circuit is the same as that of other electrolytic capacitors.
Tantalum electrolytic capacitors are widely used in communications, computers, aerospace, and military, as well as advanced electronic systems, portable digital products, and other fields.
Since tantalum electrolytic capacitors are made of very fine tantalum powder, and the dielectric constant of the tantalum oxide film is higher than that of the alumina oxide film, the capacitance per unit volume of tantalum electrolytic capacitors is large.
Tantalum electrolytic capacitor can work normally at the temperature of -50 ~100 . Although the aluminum electrolytic capacitor can work in this range, its electrical performance is not as good as that of the tantalum electrolytic capacitor.
Tantalum oxide film in tantalum electrolytic capacitors is not only corrosion-resistant but also maintains good performance for a long time.
According to the Japan Electronics and Information Technology Industries Association (JEITA), the global computers and information terminal devices export reached JPY 378,097 million (~USD 2,862.95 million) in 2021, with a growth of 106.5%. This is further expected to grow in the coming years, thereby enhancing the demand for the tantalum market.
Additionally, according to ZVEI, the global consumer electronics market is expected to grow by 5% in 2022. In 2022, the lighting segment should again manage a slightly higher growth of 6% to EUR 138.5 billion (~USD 147.08 billion), while domestic electric appliances (to EUR 287.4 billion (~USD 305.20 billion)) and consumer electronics (to EUR 268.7 billion (~USD 285.34 billion)) might each increase by 5%. This growth is expected to enhance the demand for tantalum-based capacitors from consumer electronics applications.
Asia-Pacific to Dominate the Market
Asia-Pacific was the major market for the consumption of tantalum, owing to increasing consumption from countries such as China and South Korea. The increase in demand from end-user industries, including electronics, aerospace, and medical equipment, primarily drives the region.
China is one of the major consumers of tantalum globally. Due to the increasing demand from its industries, the market studied is expected to grow in China in the coming years. China is the largest base for electronics production in the world. Electronic products, such as smartphones, TVs, wires, cables, portable computing devices, gaming systems, and other personal devices, recorded the highest growth in the electronics segment. The country not only serves domestic demand for electronics but also exports electronic output to other countries and is also a leading manufacturer of various components worldwide.
China is one of the largest aircraft manufacturers and one of the largest markets for domestic air passengers. The civil aircraft fleet in the country has been increasing steadily for the past five years. Moreover, Chinese airline companies plan to purchase about 7,690 new aircraft in the next 20 years, which were valued at approximately USD 1.2 trillion. Boeing estimated that the domestic average RPK (Revenue Passenger Kilometer) growth rate in China is expected to increase at an annual rate of 6.1% in the next 10 years. Therefore, the demand for capacitors and engine turbine blades aerospace application is increasing, which further is expected to boost the demand for the market studied.
India is expected to have a digital economy of USD 1 trillion by 2025, and the Indian electronics system design and manufacturing (ESDM) sector is expected to generate over USD 100 billion in economic value by 2025. Several policies, such as Make in India, National Policy of Electronics, Net Zero Imports in Electronics, and Zero Defect Zero Effect, offer a commitment to growth in domestic manufacturing, lowering import dependence, and energizing exports and manufacturing.
The government launched new schemes to promote electronics production in India, the scheme for Promotion of Manufacturing of Electronic Components and Semiconductors (SPECS) and the scheme for modified Electronics Manufacturing Clusters (EMC 2.0), alongside Production Linked Incentive (PLI). According to the PLI scheme, the government is likely to offer incentives as manufacturers increase production in India with USD 5.5 billion available over five years. This is likely to boost the production of electronics in the country.
South Korea is another important export-based economy in the Asia-Pacific region. South Korea has the third-largest electronics industry in the world in terms of production and fifth-largest in terms of consumption. In 2021, the electronics are valued at USD 200.79 billion.
Tantalum Industry Overview
The tantalum market is partially consolidated in terms of tantalum mining companies. The major companies (not in a particular order) include Global Advanced Metals Pty Ltd, AMG Advanced Metallurgical Group NV, Pilbara Minerals, Alliance Mineral Assets Limited, and Minsur (Mining Taboca).
Additional Benefits:
The market estimate (ME) sheet in Excel format
3 months of analyst support
TABLE OF CONTENTS
1 INTRODUCTION
1.1 Study Assumptions
1.2 Scope of the Study
2 RESEARCH METHODOLOGY
3 EXECUTIVE SUMMARY
4 MARKET DYNAMICS
4.1 Drivers
4.1.1 Increasing Demand from the Electrical and Electronics Industry
4.1.2 Extensive Usage of Tantalum Alloys in Aviation and Gas Turbines
4.2 Restraints
4.2.1 Harmful Effects of Tantalum and Decrease in Demand from End-user Industries
4.2.2 Other Restraints
4.3 Industry Value Chain Analysis
4.4 Porter's Five Forces Analysis
4.4.1 Bargaining Power of Suppliers
4.4.2 Bargaining Power of Consumers
4.4.3 Threat of New Entrants
4.4.4 Threat of Substitute Products and Services
4.4.5 Degree of Competition
4.5 Import-Export Trends
4.6 Technological Snapshot
4.7 Price Index
4.8 Regulatory Policy Analysis
5 MARKET SEGMENTATION (Market Size by Volume)
5.1 Product
5.1.1 Metal
5.1.2 Carbide
5.1.3 Powder
5.1.4 Alloys
5.1.5 Other Product Forms
5.2 Application
5.2.1 Capacitors
5.2.2 Semiconductors
5.2.3 Engine Turbine Blades
5.2.4 Chemical Processing Equipment
5.2.5 Medical Equipment
5.2.6 Other Applications (includes Ballistics, Cutting Tools, Optical Applications)
5.3 Geography
5.3.1 Production Analysis
5.3.1.1 United States
5.3.1.2 Australia
5.3.1.3 Brazil
5.3.1.4 China
5.3.1.5 Congo
5.3.1.6 Ethiopia
5.3.1.7 Nigeria
5.3.1.8 Rwanda
5.3.1.9 Other Countries
5.3.2 Consumption Analysis
5.3.2.1 Asia-Pacific
5.3.2.1.1 China
5.3.2.1.2 India
5.3.2.1.3 Japan
5.3.2.1.4 South Korea
5.3.2.1.5 Rest of Asia-Pacific
5.3.2.2 North America
5.3.2.2.1 United States
5.3.2.2.2 Canada
5.3.2.2.3 Mexico
5.3.2.3 Europe
5.3.2.3.1 Germany
5.3.2.3.2 United Kingdom
5.3.2.3.3 Italy
5.3.2.3.4 France
5.3.2.3.5 Rest of Europe
5.3.2.4 South America
5.3.2.4.1 Brazil
5.3.2.4.2 Argentina
5.3.2.4.3 Rest of South America
5.3.2.5 Middle-East and Africa
5.3.2.5.1 Saudi Arabia
5.3.2.5.2 Rest of Middle-East and Africa
6 COMPETITIVE LANDSCAPE
6.1 Mergers and Acquisitions, Joint Ventures, Collaborations, and Agreements
6.2 Market Share (%)**/Ranking Analysis
6.3 Strategies Adopted by Leading Players
6.4 Company Profiles (Overview, Financials, Products and Services, and Recent Developments)