


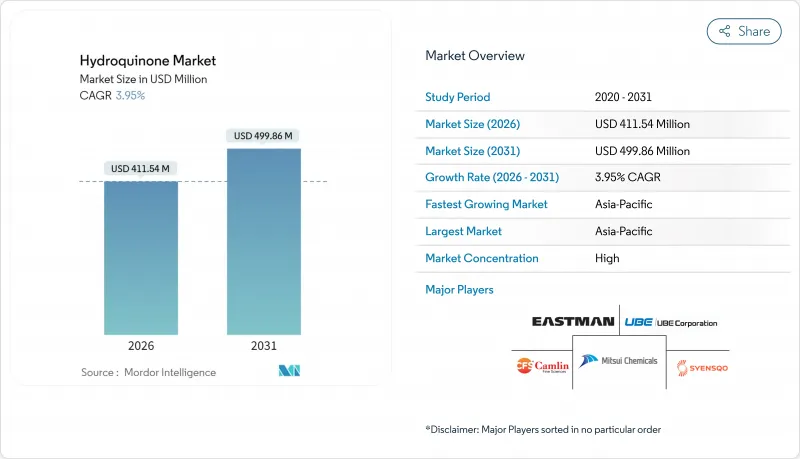
2026년 하이드로퀴논 시장 규모는 4억 1,154만 달러로 추정되며, 2025년 3억 9,590만 달러에서 성장할 것으로 예상됩니다.
2031년에는 4억 9,986만 달러에 이르고, 2026년부터 2031년까지 연평균 복합 성장률(CAGR) 3.95%를 나타낼 전망입니다.

이 확대는 중합 억제제 수요에 힘입어 화장품 용도에 대한 규제 강화의 영향을 완화하고 있습니다. 스티렌, 아크릴, 비닐 단량체와 같은 산업용 하류 수요가 플랜트 가동률을 건전하게 유지하는 반면, 생산자는 의약품 등급과 녹색 루트 등급을 제공함으로써 규제 위험을 헤지하고 있습니다. 아시아태평양의 플랜트는 페놀 아세톤 통합 생산 라인과 경쟁력있는 원료 가격을 활용합니다. 이 지역 비용 우위를 통해 현지 공급업체는 국내 컨버터와 해외 바이어 모두에 공급할 수 있습니다. 북미 및 유럽 제조업체는 USP 호환 특수 제품 및 공정 노하우를 통해 점유율을 보호하고 있습니다. 과산화수소에 의한 하이드록실화 공정의 채용과 촉매 기술의 점진적인 진보는 저배출 생산으로의 기술 전환이 점차 진행되고 있음을 보여줍니다.
피부과 클리닉에서는 미국 FDA 및 유럽 약전 기준을 준수하기 위해 화장품 등급 원료에서 USP 등급 하이드로퀴논으로의 전환이 꾸준히 진행되고 있습니다. 이스트만 케미컬은 이 표준을 위한 cGMP 라인을 운영하고, 완전한 추적성 문서가 포함된 제품을 최종 복용량 제조업체에 공급하고 있습니다. 처방의사는 글리콜산과 트레티노인을 이용한 병용요법을 지원하는 배치간의 일관성을 높이 평가하고, 이는 환자 1인당 사용량 증가를 촉진하고 있습니다. 규제 장벽이 증가함에 따라 저비용 진입이 막히고, 인증된 공급업체는 가격 프리미엄을 유지할 수 있는 반면, 의료 서비스 제공업체의 소송 위험도 감소합니다. 그 결과, 북미 및 선진 아시아 시장에서 수요 증가가 가장 두드러지며 하이드로퀴논 시장에 고수익 기회를 가져왔습니다.
고온 가공 조건 하에서 장기 보존성을 요구하는 식품 브랜드는 tert-부틸 하이드로퀴논(TBHQ) 및 관련 유도체의 채택을 확대하고 있습니다. 캠린 파인 사이언시스와 같은 통합 생산 기업은 인도 및 유럽 기지에서 하이드로퀴논 원료 및 다운스트림 공정의 TBHQ를 제조하고 있으며 가공업자에게 단일 공급 공급망을 제공합니다. 미국, EU, 일본의 규제 승인은 국경을 넘어 채용을 용이하게 하는 한편, 소비자의 클린 라벨 지향은 전반적인 배합 부하를 최소한으로 억제하는 투여 효율이 높은 첨가제에 대한 관심을 높이고 있습니다. TBHQ는 하이드로퀴논을 원료로 하기 때문에 건전한 파생품 수요는 간접적으로 베이스 그레이드의 소비를 지지해, 다른 최종 용도에 있어서 주기성으로부터 하이드로퀴논 시장을 강화하고 있습니다.
유럽화학물질청은 씻어내지 않는 화장품에 대한 하이드로퀴논 사용을 제한하고 있으며 인도네시아 및 기타 신흥 시장의 규제 당국도 비슷한 자세를 보이고 있습니다. 적합하지 않은 미백 로션과 관련된 제품 리콜은 소비자의 신뢰를 잃어 버리고, 배합 설계자의 알부틴과 코디 산으로의 전환을 가속화하고 있습니다. 소규모 화장품 제조업체는 재배합 및 시험 비용을 걱정하고 있으며 이미 축소 경향이 있는 부문 수요를 더욱 줄이고 있습니다. 산업용도는 영향을 받지 않는 것, 부정적인 여론이 인접 카테고리에도 파급해, 유통업체는 보다 엄격한 컴플라이언스 문서와 보험 커버를 유지할 수밖에 없습니다.
하이드로퀴논은 라디칼 중합을 억제하는 효과에서 그 밖에 유례가 없기 때문에 중합 억제제는 2025년의 수익의 66.58%를 차지했습니다. 2031년까지 연평균 복합 성장률(CAGR)은 4.28%를 유지하며 하이드로퀴논 시장에서 가장 크고 가장 빠른 성장 부문을 유지합니다. 수지 플랜트에서는 스티렌, 아크릴레이트, 비닐 모노머의 저장시에 10-200ppm을 첨가해, 폭주 반응에 의한 규격외 배치나 안전상의 위험을 방지하고 있습니다. 아시아태평양으로의 생산 거점의 이행이 진행되고 있는 가운데, 새로운 모노머 복합체의 가동 개시에 수요가 확대되고 있습니다. 항산화제 및 사진 용도는 틈새 시장으로 남아 있지만 특수 아날로그 필름과 고성능 폴리머에 대한 관심 재연으로 수익성이 높은 분야를 유지하고 있습니다. 프로세스 혁신 기업은 현재 작업자 노출을 최소화하고 라인 얼룩을 줄이는 서방형 억제제 향주를 개발 중이며 미래 수익에서 서비스 요소의 비율을 높이고 있습니다.
중합 억제제의 중앙 공급 구조에는 순환 위험도 내재되어 있습니다. 단량체 생산 능력의 향상은 판매를 밀어 올리는 반면, 수지 생산의 감속은 출하량에 심각한 영향을 미칠 수 있습니다. 그러나 다양한 단량체종과 안전면에서의 중요성이 함께, 경기후퇴기에도 하이드로퀴논 시장이 완전히 붕괴되는 사태는 회피될 전망입니다. 활성탄 담지형 하이드로퀴논 촉매를 이용한 신흥의 화장품 용도는 주시해야 하지만 초기 단계의 규모 때문에 핵심 예측 대상외입니다. 산업 구매 부서는 벤더리스트의 효율성을 높이기 위해 폴리머 표준과 식품 접촉 표준을 모두 충족하는 이중 인증 등급을 점점 더 요구하고 있으며, 이러한 변화는 수직 통합 생산자에게 유리하게 작용합니다.
아시아태평양은 2025년 수익의 47.82%를 차지했으며 2031년까지 연평균 복합 성장률(CAGR) 4.31%를 나타내 하이드로퀴논 시장에서 우위를 유지합니다. 중국의 완전통합형 페놀아세톤 복합시설은 경쟁력 있는 원료가격을 보장하는 한편 인도에서는 캠린 파인사이언시스를 필두로 하는 특수화학제품 대기업이 다해지의 연간 1만 5,000톤 생산설비를 통해 세계적인 공급량을 확보하고 있습니다.
북미에서는 높은 생산 비용을 의약품과 하이엔드 산업 분야의 견조한 수요로 상쇄하고 있습니다. Eastman Chemical은 수직 통합 및 FDA 등록 시설을 활용하여 USP 표준 및 특수 사진 등급을 세계에 공급합니다.
유럽에서는 에너지 비용의 상승과 REACH 규제의 진화에 계속 대응을 촉구하고 있습니다. 화장품 용도는 제한되지만 산업용 생산량은 유지됩니다. 생산자는 배출량 감축을 위한 공정 개량에 투자하고 ESG 지표에 연동한 기업 조달 포인트의 획득을 목표로 하고 있습니다. 미쓰이화학과 미쓰비시화학에 의한 페놀 공급 조사와 같은 제휴는 원료 조달 위험의 저감과 자산 배치의 최적화를 위한 지역적 노력을 나타냅니다.
남미, 중동, 아프리카 등의 소규모 지역에서는 새로운 석유화학공업단지의 가동에 따라 성장의 조짐이 보이지만, 특수급에 대해서는 여전히 수입 의존도가 높아 아시아태평양 수출업체가 공급량을 강화하는 입장에 있습니다.
Hydroquinone market size in 2026 is estimated at USD 411.54 million, growing from 2025 value of USD 395.90 million with 2031 projections showing USD 499.86 million, growing at 3.95% CAGR over 2026-2031.
The expansion is anchored in polymerization inhibitor demand, which cushions overall growth against stricter rules in cosmetic uses. Industrial downstreams in styrene, acrylic, and vinyl monomers keep plant utilization healthy, while producers hedge regulatory risk by offering pharmaceutical-grade and green-route grades. Asia-Pacific plants leverage integrated phenol-acetone chains and competitively priced feedstock; this regional cost edge allows local suppliers to serve both domestic converters and overseas buyers. North American and European makers defend their share through USP-compliant specialties and process know-how. Adoption of hydrogen-peroxide hydroxylation routes, together with incremental catalyst advances, signals a gradual technology pivot toward lower-emission production.
Dermatology clinics steadily replace cosmetic-grade material with USP-grade hydroquinone to comply with U.S. FDA and European Pharmacopoeia standards. Eastman Chemical runs cGMP lines dedicated to this specification, supplying finished-dose formulators with fully traceable documentation. Prescribers appreciate batch consistency that supports combination therapies using glycolic acid or tretinoin, driving per-patient volume. Higher regulatory barriers deter low-cost entrants, letting qualified suppliers command price premiums while reducing litigation risk for healthcare providers. The resulting demand uplift is strongest in North America and advanced Asian markets, providing a margin-rich pocket for the hydroquinone market.
Food brands seeking longer shelf life at elevated processing temperatures increasingly favor tert-butylhydroquinone (TBHQ) and related derivatives. Integrated producers such as Camlin Fine Sciences manufacture both hydroquinone feedstock and downstream TBHQ at Indian and European sites, giving converters a single-source supply chain. Regulatory approvals in the U.S., EU, and Japan ease cross-border adoption, while consumer preference for cleaner labels fuels interest in dosage-efficient additives that minimize overall formulation load. Since TBHQ starts from hydroquinone, healthy derivative demand indirectly sustains base-grade consumption, fortifying the hydroquinone market against cyclicality in other end uses.
The European Chemicals Agency restricts hydroquinone in leave-on cosmetics, a stance echoed by regulators in Indonesia and other emerging markets. Product recalls linked to non-compliant whitening lotions erode consumer trust and accelerate formulator migration to arbutin or kojic acid. Small cosmetic producers struggle with the cost of reformulation and testing, trimming demand from an already contracting segment. While industrial uses remain untouched, negative public perception spills into adjacent categories, forcing distributors to maintain higher compliance documentation and insurance coverage.
Other drivers and restraints analyzed in the detailed report include:
For complete list of drivers and restraints, kindly check the Table Of Contents.
Hydroquinone's unrivaled effectiveness in quenching radical polymerization gave polymerization inhibitors 66.58% of 2025 revenue. The segment's 4.28% CAGR to 2031 keeps it as both largest and fastest within the hydroquinone market. Resin plants dose 10-200 ppm during styrene, acrylate, and vinyl monomer storage, preventing runaway reactions that otherwise trigger off-spec batches or safety hazards. Geographic production shifts toward Asia-Pacific amplify demand as new monomer complexes come online. Antioxidant and photographic applications remain niche; however, renewed interest in specialty analog film and high-performance polymers preserves a profitable tail. Process innovators are now devising controlled-release inhibitor sachets that minimize operator exposure and reduce line fouling, raising the service component of future revenues.
The concentration in polymerization inhibitors also embeds cyclic exposure: monomer capacity additions boost sales, whereas resin production slowdowns can materially dent shipments. Still, the breadth of monomer types and the critical safety role insulate the hydroquinone market from complete collapse in downturns. Emerging cosmetic uses involving activated-carbon-supported hydroquinone catalysts warrant monitoring, yet their early-stage scale keeps them outside core forecasts. Industrial buyers increasingly demand dual-certified grades meeting both polymer and food-contact standards to streamline vendor lists, a shift that favors vertically integrated producers.
The Hydroquinone Market Report is Segmented by Application (Intermediate, Antioxidant, Polymerization Inhibitor, and Photosensitive Chemical), Production Process (Cumene Hydroperoxide Route, H2O2 Hydroxylation of Phenol, and Aniline Oxidation), End-Use Industry (Cosmetics, Polymers, Paints and Adhesives, and More), and Geography (Asia-Pacific, North America, and More). The Market Forecasts are Provided in Terms of Value (USD).
Asia-Pacific owned 47.82% of 2025 revenue and will expand at a 4.31% CAGR to 2031, underpinning its primacy in the hydroquinone market. China's fully integrated phenol-acetone complexes ensure competitively priced feedstock, while India's specialty chemical champions, led by Camlin Fine Sciences, add globe-serving volumes through the Dahej 15,000 tons per year unit.
North America balances higher production costs with robust demand from pharmaceutical and high-end industrial niches. Eastman Chemical exploits vertical integration and FDA-registered facilities to deliver USP-grade and specialty photographic grades worldwide.
Europe continues to wrestle with rising energy costs and evolving REACH regulations that restrict cosmetic use but leave industrial volumes intact. Producers invest in process upgrades to curtail emissions and win corporate procurement points tied to ESG metrics. Partnerships like Mitsui Chemicals' and Mitsubishi Chemical's phenol-supply study illustrate regional efforts to de-risk feedstock exposure and optimize asset footprints.
Smaller regions, South America, the Middle East, and Africa, register nascent growth as new petrochemical parks come online, yet they still depend heavily on imports for specialized grades, positioning Asia-Pacific exporters to reinforce volume flows.