일본의 지리공간 분석 : 시장 점유율 분석, 산업 동향 및 통계, 성장 예측(2024-2029년)
Japan Geospatial Analytics - Market Share Analysis, Industry Trends & Statistics, Growth Forecasts (2024 - 2029)
상품코드:1549972
리서치사:Mordor Intelligence
발행일:2024년 09월
페이지 정보:영문
라이선스 & 가격 (부가세 별도)
ㅁ Add-on 가능: 고객의 요청에 따라 일정한 범위 내에서 Customization이 가능합니다. 자세한 사항은 문의해 주시기 바랍니다.
ㅁ 보고서에 따라 최신 정보로 업데이트하여 보내드립니다. 배송기일은 문의해 주시기 바랍니다.
한글목차
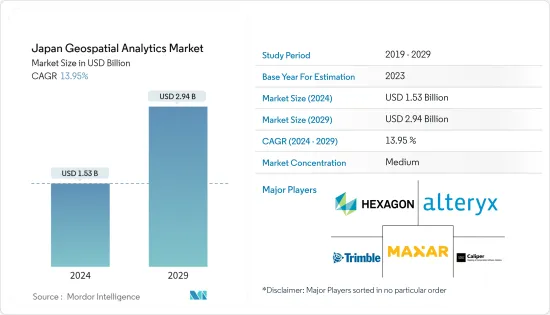
일본의 지리공간 분석 시장 규모는 2024년 15억 3,000만 달러로 추정되며, 2029년에는 29억 4,000만 달러에 달할 것으로 예상되며, 예측 기간(2024-2029년) 동안 13.95%의 CAGR로 성장할 것으로 예상됩니다.
주요 하이라이트
지리공간 분석은 GPS, 위성사진 등 지리정보 시스템(GIS) 데이터와 이미지를 수집, 조작, 표시하는 과정입니다. 일본의 지리공간 분석 시장의 전년도 시장 규모는 14억 달러로 향후 5년간 연평균 12.69%의 CAGR을 기록하며 28억 1,000만 달러에 달할 것으로 예상됩니다.
일본의 지리공간 분석 시장은 스마트 시티 개발 프로젝트 채택이 증가함에 따라 크게 성장하고 있습니다. 이러한 노력은 도시 인프라를 강화하고, 공공 서비스를 개선하며, 자원 관리를 최적화하기 위해 첨단 기술을 활용하고 있습니다. 일본 도시들은 지리적 공간 분석을 계획과 운영에 통합함으로써 공간 데이터를 더 잘 분석하고, 환경 변화를 모니터링하고, 정보에 입각한 의사결정을 내릴 수 있게 되었습니다. 이러한 추세는 앞으로도 시장을 주도하고 혁신과 투자에 대한 수많은 기회를 제공할 것으로 예상됩니다.
예를 들어, 조지아공과대학과 도쿄대학의 공동 연구인 도쿄 스마트 시티 스튜디오는 도쿄의 스마트하고 생태적인 커뮤니티 개발을 목표로 하는 연구 프로그램입니다. 이 프로그램은 지리적 공간 분석 및 기타 기술을 활용하여 도시 계획, 교통, 에너지 소비 등의 데이터를 분석 및 시각화합니다.
또한 5G 기술의 보급은 일본의 지리공간 분석 시장의 수요와 성장을 크게 강화하고 있으며, 5G의 등장으로 지리공간 분석의 기능이 확장되어 더 빠른 데이터 처리, 더 높은 정확도, 실시간 분석 기능을 제공하고 있습니다. 이러한 기술 발전으로 교통, 도시 계획, 재난 관리 등 다양한 분야에서 지공간 데이터를 보다 효과적으로 활용할 수 있게 되었습니다. 그 결과 일본의 지리공간 분석 시장은 5G 기술 채택 확대에 힘입어 강력한 성장세를 보이고 있습니다.
일본에서는 몇 가지 요인이 지리공간 분석 시장을 견인하고 있지만, 높은 비용과 운영상의 어려움으로 인해 수요와 성장에 큰 제약이 되고 있습니다. 소프트웨어, 하드웨어, 숙련된 인력 등 지리공간 분석 솔루션 도입에 따른 높은 비용은 많은 조직에 큰 장벽으로 작용하고 있습니다. 또한, 데이터 프라이버시 문제, 통합의 복잡성, 지속적인 업데이트 및 유지보수의 필요성과 같은 운영상의 문제도 시장 확대에 걸림돌로 작용하고 있습니다.
일본의 지리공간 분석 시장 동향
재난 위험 경감 및 관리
일본에서 자연재해의 빈도와 강도가 증가함에 따라 고급 지리공간 분석의 도입이 필요하게 되었습니다. 이러한 도구는 이러한 사건의 영향을 예측, 대비 및 완화하는 데 도움이 되어 일본의 재난 복원력을 향상시키는 데 도움이 되고 있습니다. 예를 들어, 지리공간 분석은 잠재적인 재난 시나리오를 모델링하여 당국이 보다 효과적인 대피 계획과 자원 배분 전략을 수립할 수 있도록 돕습니다.
또한, 재해 위험 감소를 위한 정부의 노력과 정책도 지리공간 분석 시장의 성장에 크게 기여하고 있습니다. 일본 정부는 재난 관리 전략을 개선하기 위해 첨단 기술에 투자하고 있으며, 이는 지리공간 분석에 대한 수요를 촉진하고 있습니다. 국가 회복탄력성 프로그램, 방재기본계획 등의 프로그램은 재난 대비와 대응을 강화하기 위해 지형공간 데이터 통합을 강조하고 있습니다.
또한, 지리적 공간 분석과 인공지능 및 빅데이터와 같은 다른 기술과의 통합은 재난 관리 분야에서 새로운 혁신의 기회를 창출하고 있습니다. 이러한 통합은 효과적인 재난 대응과 복구에 필수적인 보다 정확하고 시기적절한 데이터 분석을 가능하게 합니다. 예를 들어, AI 알고리즘은 지리적 공간 데이터를 분석하여 태풍의 경로를 예측하여 보다 신속하고 정확한 비상 대응을 가능하게 합니다.
2023년 9월, 일본 히로시마현에 위치한 히가시히로시마시는 ASP.NET용 TatukGIS 개발자 커널(DK)로 구동되는 이 플랫폼은 다수의 농업용 저수지와 관련된 홍수 위험을 평가할 수 있도록 설계되었습니다. 평가할 수 있도록 설계되었습니다.
높아지는 위치 정보 서비스(LBS) 수요
일본에서 위치 정보 서비스(LBS)의 인기가 높아지면서 지리공간 분석 시장 확대에 크게 기여하고 있습니다. 이러한 서비스는 실시간 지리 데이터를 활용하여 정보, 엔터테인먼트, 보안을 제공하고 사용자 경험과 업무 효율성을 향상시킵니다. 내비게이션, 소셜 네트워킹, 모바일 마케팅 등 다양한 애플리케이션에 LBS가 통합되면서 지리공간 분석 솔루션에 대한 수요가 급증하고 있습니다.
또한, 기술 발전은 위치정보 서비스의 보급에 중요한 역할을 하고 있습니다. 스마트폰의 보급과 초고속 인터넷 인프라 구축으로 소비자와 기업이 LBS에 쉽게 접근하고 활용할 수 있게 되었으며, 2023년 일본의 스마트폰 보유율은 약 79%로 2010년대 중반 이후 큰 폭으로 상승했습니다. 이러한 기술 발전은 보다 정확하고 신뢰할 수 있는 지형 공간 데이터 수집을 가능하게 하여 일본의 지리공간 분석 시장을 더욱 활성화시켰습니다.
또한, 일본 정부는 다양한 공공 서비스 및 도시 계획 구상에 지공간 정보 활용을 적극적으로 추진하고 있습니다. 지형공간 데이터 인프라를 개선하기 위한 정부의 정책과 투자는 지리공간 분석 시장 성장에 유리한 환경을 조성하고 있습니다. 이러한 노력은 다양한 분야에서 지형공간 기술의 혁신과 채택을 더욱 촉진할 것으로 예상됩니다.
또한, 운송, 물류, 소매 산업에서 지리공간 분석의 활용이 확대되고 있는 것도 시장 성장에 기여하고 있습니다. 이들 분야의 기업들은 지리공간 데이터를 활용하여 경로를 최적화하고, 자산을 관리하며, 고객 경험을 개선하고 있습니다. 공간 데이터 분석 및 시각화는 기업이 정보에 입각한 의사결정을 내리고 운영 효율성을 개선하는 데 도움이 되는 귀중한 인사이트를 제공합니다.
일본의 지리공간 분석 산업 개요
일본의 지리공간 분석 시장은 Hexagon AB와 같은 대기업이 지배하고 있지만, 통합의 추세를 목격하고 있습니다. 이들 주요 기업들은 시장에서의 입지를 강화하기 위해 전략적으로 제휴 및 인수를 추진하고 있습니다. 동시에 첨단 지형 공간 도구를 개발하기 위해 기술 혁신, 새로운 애플리케이션 개발 및 연구 개발에 집중하고 있습니다. 이러한 도구는 도시 계획, 재난 관리, 환경 모니터링 등 다양한 분야에 적용되고 있습니다. 이러한 노력은 향후 몇 년 동안 시장 성장을 촉진할 것입니다.
2024년 1월, AWS는 2027년까지 일본에 2조 2,600억 엔(152억 4,000만 달러)을 투자하여 일본 클라우드 컴퓨팅 인프라를 확장할 계획을 발표했으며, AWS는 도쿄와 오사카의 시설을 확장하는 것 외에도 AWS의 교육 프로그램, 교육, 훈련, 인증을 통해 디지털 기술 격차를 해소함으로써 일본의 클라우드 잠재력을 끌어낼 수 있도록 지원할 계획입니다.
기타 혜택
엑셀 형식의 시장 예측(ME) 시트
3개월간의 애널리스트 지원
목차
제1장 소개
조사 가정과 시장 정의
조사 범위
제2장 주요 요약
제3장 조사 방법
제4장 시장 인사이트
시장 개요
업계의 매력 - Porter's Five Forces 분석
신규 참여업체의 위협
구매자의 교섭력
공급 기업의 교섭력
대체품의 위협
경쟁 기업 간의 경쟁 강도
산업 밸류체인 분석
거시경제 요인이 시장에 미치는 영향
제5장 시장 역학
시장 성장 촉진요인
스마트 시티 개발 채용 증가
시장 성장을 촉진하는 5G 소개
시장 성장 억제요인
고비용과 운영상 우려
법적 허들
제6장 시장 세분화
유형별
서피스 분석
네트워크 해석
지오 시각화
최종 이용 업계별
농업
유틸리티와 통신
방위·정보
정부기관
광업·천연자원
자동차·운송
헬스케어
부동산·건설
기타 최종 이용 업계별
제7장 경쟁 상황
기업 개요
Alteryx
Hexagon AB
TomTom
Maxar Technologies
Trimble
ESRI
Caliper Corporation
General Electric
Bentley Systems Co.
Fugro
제8장 투자 분석
제9장 시장 기회와 향후 동향
ksm
영문 목차
영문목차
The Japan Geospatial Analytics Market size is estimated at USD 1.53 billion in 2024, and is expected to reach USD 2.94 billion by 2029, growing at a CAGR of 13.95% during the forecast period (2024-2029).
Key Highlights
Geospatial analytics is the process of gathering, manipulating, and displaying geographic information system (GIS) data and imagery, including GPS and satellite photographs. The Japanese geospatial analytics market was valued at USD 1.40 billion in the previous year, and it is expected to register a CAGR of 12.69%, reaching USD 2.81 billion by the next five years.
The Japanese geospatial analytics market is experiencing significant growth due to the increasing adoption of smart city development projects. These initiatives leverage advanced technologies to enhance urban infrastructure, improve public services, and optimize resource management. As cities in Japan integrate geospatial analytics into their planning and operations, they better analyze spatial data, monitor environmental changes, and make informed decisions. This trend is expected to continue driving the market forward, offering numerous opportunities for innovation and investment in the coming years.
For instance, the Tokyo Smart City Studio, a collaboration between the Georgia Institute of Technology and the University of Tokyo, is a research program that aims to develop a smart and ecologically sound community in Tokyo. The program uses geospatial analytics and other technologies to analyze and visualize urban planning, transportation, energy consumption, and more data.
Also, the deployment of 5G technology is significantly enhancing the demand and growth of the geospatial analytics market in Japan. With the advent of 5G, the capabilities of geospatial analytics are expanding, offering faster data processing, improved accuracy, and real-time analytics. This technological advancement enables various sectors, including transportation, urban planning, and disaster management, to leverage geospatial data more effectively. As a result, the geospatial analytics market in Japan is experiencing robust growth, driven by the increased adoption of 5G technology.
In Japan, while several factors propel the geospatial analytics market, high costs and operational challenges are significant constraints that impede its demand and growth. The high costs associated with implementing geospatial analytics solutions, including software, hardware, and skilled personnel, pose a substantial barrier for many organizations. Additionally, operational concerns such as data privacy issues, integration complexities, and the need for continuous updates and maintenance further hinder the market's expansion.
Japan Geospatial Analytics Market Trends
Disaster Risk Reduction and Management
The increasing frequency and intensity of natural disasters in Japan have necessitated the adoption of advanced geospatial analytics. These tools help predict, prepare for, and mitigate the impacts of such events, thereby enhancing the country's disaster resilience. For instance, geospatial analytics can model potential disaster scenarios, allowing authorities to develop more effective evacuation plans and resource allocation strategies.
Also, government initiatives and policies aimed at disaster risk reduction significantly contribute to the growth of the geospatial analytics market. The Japanese government has been investing in advanced technologies to improve disaster management strategies, which drives the demand for geospatial analytics. Programs such as the National Resilience Program and the Basic Plan for Disaster Risk Reduction emphasize the integration of geospatial data to enhance disaster preparedness and response.
Also, the integration of geospatial analytics with other technologies, such as artificial intelligence and big data, is creating new opportunities for innovation in disaster management. This integration allows for more accurate and timely data analysis, crucial for effective disaster response and recovery. For example, AI algorithms are used to analyze geospatial data to predict the path of a typhoon, enabling quicker and more precise emergency responses.
In September 2023, Higashihiroshima City, located in the Hiroshima Prefecture of Japan, launched an advanced web GIS application for flood hazard and disaster prevention. This platform, powered by the TatukGIS developer kernel (DK) for ASP.NET, is engineered to assess flood risks associated with numerous agricultural irrigation reservoirs.
Growing Demand for Location-based Services
Location-based services (LBS) have become increasingly popular in Japan, contributing significantly to the expansion of the geospatial analytics market. These services utilize real-time geographical data to provide information, entertainment, and security, enhancing user experience and operational efficiency. The integration of LBS in various applications, such as navigation, social networking, and mobile marketing, has led to a surge in demand for geospatial analytics solutions.
Moreover, technological advancements have played a crucial role in the proliferation of location-based services. The widespread adoption of smartphones and the development of high-speed internet infrastructure have made it easier for consumers and businesses to access and utilize LBS. In 2023, smartphone ownership in Japan surged to nearly 79%, marking a substantial rise from the mid-2010s. This technological progress has enabled more precise and reliable geospatial data collection, further boosting the geospatial analytics market in Japan.
Additionally, the Japanese government has been actively promoting the use of geospatial information for various public services and urban planning initiatives. Government policies and investments to improve geospatial data infrastructure have created a favorable environment for the growth of the geospatial analytics market. These initiatives are expected to drive further innovation and adoption of geospatial technologies across different sectors.
Also, the increasing use of geospatial analytics in transportation, logistics, and retail industries contributes to market growth. Companies in these sectors are leveraging geospatial data to optimize routes, manage assets, and enhance customer experiences. Analyzing and visualizing spatial data provides valuable insights that help businesses make informed decisions and improve operational efficiency.
Japan Geospatial Analytics Industry Overview
The Japanese geospatial analytics market, dominated by major players like Hexagon AB, is witnessing a trend toward consolidation. These key players are strategically partnering and acquiring to fortify their market presence. Simultaneously, they innovate, roll out new applications, and focus on R&D to craft advanced geospatial tools. These tools are tailored for diverse sectors, spanning urban planning, disaster management, and environmental monitoring. Such initiatives are poised to propel market growth in the coming years.
In January 2024, AWS announced plans to invest JPY 2.26 trillion (USD 15.24 billion) in Japan by 2027 to expand cloud computing infrastructure in the country. In addition to expanding its facilities in Tokyo and Osaka, AWS planned to help Japan unlock its cloud potential by addressing the digital skills gap through AWS education programs, training, and certification.
Additional Benefits:
The market estimate (ME) sheet in Excel format
3 months of analyst support
TABLE OF CONTENTS
1 INTRODUCTION
1.1 Study Assumptions and Market Definition
1.2 Scope of the Study
2 EXECUTIVE SUMMARY
3 RESEARCH METHODOLOGY
4 MARKET INSIGHTS
4.1 Market Overview
4.2 Industry Attractiveness - Porter's Five Forces Analysis
4.2.1 Threat of New Entrants
4.2.2 Bargaining Power of Buyers
4.2.3 Bargaining Power of Suppliers
4.2.4 Threat of Substitute Products
4.2.5 Intensity of Competitive Rivalry
4.3 Industry Value Chain Analysis
4.4 Impact of Macroeconomic Factors on Market
5 MARKET DYNAMICS
5.1 Market Drivers
5.1.1 Increase In Adoption of Smart City Development