


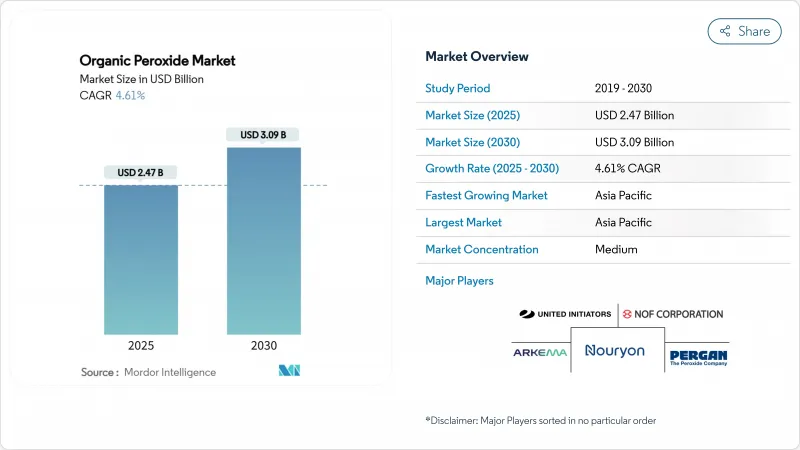
유기 과산화물 시장 규모는 2025년에 24억 7,000만 달러로 평가되었고, 2030년에 30억 9,000만 달러에 이를 것으로 추정 및 예측되며, 예측 기간(2025-2030년)의 CAGR은 4.61%를 나타낼 전망입니다.

첨단 폴리에틸렌 및 폴리프로필렌 등급의 사용 증가, EVA 태양광 캡슐화제의 급속한 보급, 그리고 VOC가 없는 분체 코팅 시스템으로의 전환이 수요 증가를 뒷받침하고 있습니다. 생산사들은 엄격한 사양 관리가 필요한 폴리머 및 복합재료 고객사를 지원하기 위해 아시아태평양 지역에서 생산 능력을 확대하고 있으며, 안전성에 중점을 둔 페이스트 및 에멀젼 형태가 더 널리 수용되고 있습니다. 동시에 원료 가격 변동성과 저장 시설에 대한 높은 보험료는 계속해서 마진을 압박하여 제조업체들이 재생 가능한 원료와 더 안전한 취급 솔루션으로 전환하도록 유도하고 있습니다. 아시아태평양 지역은 양적 및 증분 수요 모두를 주도하며, 지속가능성 규제로 제품 대체가 가속화되는 북미와 유럽에서는 꾸준하지만 보다 전문화된 성장이 뒤따릅니다.
포장재 및 자동차 부품 분야에서 제어된 유변학적 특성의 폴리프로필렌과 고용융강도 PP에 대한 수요 증가로 아시아태평양 지역 유기 과산화물 소비량이 상승하고 있습니다. LyondellBasell은 2024년 재생 및 재생 기반 폴리머 생산량을 65% 증가시켜 20만 톤 이상으로 확대했으며, 2030년까지 연간 200만 톤 생산을 목표로 하고 있어 분자량과 분지를 정밀하게 조절하는 유기 과산화물의 수요가 증가하고 있습니다. 가산업체들은 디쿠밀 퍼옥사이드를 사슬 분해제로 적용할 경우 PP 가공 효율이 18% 향상된다고 보고하며, 퍼카독스(Perkadox) 및 트리고녹스®(Trigonox®) 등급으로 제조된 분지형 PP는 발포 특성이 30% 개선됩니다. 지역 수지 생산사들이 특수 제품 생산 능력을 확대함에 따라 유기 과산화물 시장은 안정적인 수요 기반을 확보하고 있습니다.
급성장하는 태양광 설비 설치는 75% 이상의 겔 함량을 달성하여 모듈 내구성을 향상시키기 위해 루퍼록스 TBEC(Luperox TBEC)와 같은 과산화물로 가교된 EVA 캡슐레이션 시트에 의존합니다. 중국이 EVA 시트 생산을 주도하고 있으며, 유럽 모듈 제조사들도 전력 손실을 억제하기 위해 고순도 과산화물 시스템으로 업그레이드하고 있습니다. 이러한 추세는 단기적으로 유기 과산화물 시장, 특히 좁은 분해 특성을 제공하는 고압 중합 등급의 꾸준한 증분 수요로 이어질 전망입니다.
2025년 1월 1일 개정 ADR 프레임워크 시행으로 유기 과산화물 창고 분류 및 검사 기준이 강화됩니다. 유럽 보험사들은 대용량 시설에 대한 보험료를 인상하여 운영 비용을 증가시키고 확장 프로젝트를 지연시키고 있습니다. 생산자들은 재고 수준 최적화와 소규모 위성 창고 투자로 대응하고 있으나, 고정 비용 증가로 유기 과산화물 시장의 마진 확대가 제약받고 있습니다.
2024년 유기 과산화물 시장에서 벤조일 퍼옥사이드의 판매 점유율은 24%였습니다. 자유 라디칼 중합이 스티렌계 및 아크릴계 수지의 고생산성 공정으로 남아있기 때문에 산업용 등급 물량이 주를 이룹니다. 그럼에도 불구하고 특정 소비자 제품에서의 벤젠 오염 우려가 감시를 강화시켜 제품 재구성을 촉진하고 있습니다.
퍼카보네이트는 친환경적 특성과 광범위한 세정제 수요에 힘입어 4.74%의 연평균 복합 성장률(CAGR)로 가장 빠르게 성장하는 하위 부문입니다. 폐수 정화를 위한 퍼카보네이트 기반 고급 산화 공정의 상용화는 고객 기반을 확대하고 향후 시장 점유율 확대를 뒷받침할 것입니다.
중합 개시제는 2024년 유기 과산화물 시장 점유율의 65%를 차지했으며, 2030년까지 연평균 5.22%의 성장률을 기록할 것으로 전망됩니다. 고생산성 LDPE 및 PP 설비에서는 예측 가능한 분해 동역학 덕분에 테르트-부틸 퍼옥시-2-에틸헥사노에이트와 같이 특성이 잘 알려진 개시제가 선호됩니다. 가교제는 차순위로 큰 규모를 차지하며, 고온에서 치수 안정성이 요구되는 전선 및 케이블 피복재, 발포 단열재, 복합재료 부품에 사용됩니다. 경화제는 규모는 작지만 3D 프린팅 및 고압 RTM 복합재용 첨단 수지 화학 분야에서 중요성이 증가하고 있습니다.
아시아태평양 지역은 2024년 유기 과산화물 시장의 39%를 차지했으며, 강력한 다운스트림 플라스틱 및 탄성 중합체 생산 능력 증대에 힘입어 연평균 4.89%의 성장률을 보이고 있습니다. 중국이 지역 수요를 주도하고 있으며, 누리온(Nouryon)이 2024년 11월 닝보에서 확장을 통해 퍼카독스 14(Perkadox 14)와 트리고녹스 101(Trigonox 101)의 생산량을 6,000톤으로 두 배로 늘렸는데, 이는 제어된 유변학 조절제에 대한 현지 수요를 강조하는 것입니다.
북미는 자동차 복합재료, 의료, 고순도 반도체 폴리머 분야에서 성숙하지만 부가가치가 높은 수요가 특징입니다. 제조사들은 안전성 강화된 제형을 강조하며, 다수 기업이 대량 과산화물 운송에 대한 미국 교통부(DOT)의 강화된 지침에 부합하는 유화형 개시제를 출시했습니다.
유럽은 그 뒤를 바짝 쫓고 있으며, VOC 배출 제한 및 위험물 안전 운송 의무화를 규정한 환경 법규가 성장을 주도하고 있습니다. 2025년 시행 예정인 ADR 개정안은 저장 분리 및 교육 요건을 강화하여 운영 비용을 증가시키지만, 페이스트 및 폴리머 결합 형태의 채택을 촉진할 전망입니다.
The Organic Peroxide Market size is estimated at USD 2.47 billion in 2025, and is expected to reach USD 3.09 billion by 2030, at a CAGR of 4.61% during the forecast period (2025-2030).
The rising use of advanced polyethylene and polypropylene grades, rapid uptake of EVA solar encapsulants, and the shift toward VOC-free powder coating systems underpin demand growth. Producers are scaling capacity in Asia Pacific to serve polymer and composites customers that require tight specification control, while safety-focused paste and emulsion formats gain wider acceptance. At the same time, volatile feedstock pricing and higher insurance premiums for storage facilities continue to pressure margins, steering manufacturers toward renewable feedstocks and safer handling solutions. Asia Pacific anchors both volume and incremental demand, followed by steady but more specialized growth in North America and Europe, where sustainability regulations accelerate product substitution.
Rising requirements for controlled rheology polypropylene and high-melt-strength PP in packaging and automotive parts lift organic peroxide consumption across Asia Pacific. LyondellBasell raised recycled and renewable-based polymer output by 65% in 2024 to more than 200,000 t, with a target of 2 million t annually by 2030, increasing the need for organic peroxides that fine-tune molecular weight and branching. Processors report an 18% jump in PP processing efficiency when dicumyl peroxide is applied as a chain breaker, while branched PP made with Perkadox and Trigonox(R) grades delivers 30% better foam properties. As regional resin producers expand specialty capacity, the organic peroxide market gains a stable demand base.
Fast-growing photovoltaic installations rely on EVA encapsulation sheets cross-linked with peroxides such as Luperox TBEC to reach gel contents above 75%, thereby enhancing module durability. China dominates EVA sheet output, and European module makers are also upgrading to higher-purity peroxide systems to curb power loss. These trends translate into steady incremental volumes for the organic peroxide market in the near term, especially for high-pressure polymerization grades that offer narrow decomposition profiles.
Implementation of the revised ADR framework on 1 January 2025 elevates classification and inspection rigor for organic peroxide warehousing. European underwriters have lifted premiums for large-volume sites, raising operating costs and delaying expansion projects. Producers are responding by optimizing inventory levels and investing in smaller satellite depots, yet higher fixed costs constrain margin expansion for the organic peroxide market.
Other drivers and restraints analyzed in the detailed report include:
For complete list of drivers and restraints, kindly check the Table Of Contents.
Benzoyl peroxide retained a 24% revenue share of the organic peroxide market in 2024, reflecting its dual usage in polymer initiation and topical dermatology. Industrial grade volumes dominate because free-radical polymerization remains a high-throughput route for styrenics and acrylics. Nevertheless, concerns over benzene contamination in certain consumer products have raised scrutiny, spurring product reformulation.
Percarbonates, propelled by eco-friendly credentials and broad cleaning-agent appeal, are the fastest-growing sub-segment at a 4.74% CAGR. Commercialization of percarbonate-based advanced oxidation processes for wastewater remediation broadens the customer mix and supports future share gains.
Polymerization initiators captured 65% of the organic peroxide market share in 2024 and are forecast to post a 5.22% CAGR to 2030. High throughput LDPE and PP facilities favor well-characterized initiators such as tert-butyl peroxy-2-ethylhexanoate owing to predictable decomposition kinetics. Cross-linking agents are the next-largest category, used in wire-and-cable jacketing, foam insulation, and composite parts that need dimensional stability at elevated temperatures. Curing and hardening agents, though smaller in volume, gain importance in advanced resin chemistries for 3D printing and high-pressure RTM composites.
The Organic Peroxide Market Report Segments the Industry by Type (Diacyl Peroxides, Dialkyl Peroxides, Ketone Peroxides, and More), Function (Polymerization Initiators, and More), Form (Liquid, Solid, and Paste/Emulsion), Application (Polymers and Rubber, Coatings and Adhesives, Paper and Textile, Cosmetics, and More), and Geography (Asia-Pacific, North America, Europe, South America, and Middle-East and Africa).
Asia Pacific held 39% of the organic peroxide market in 2024 and is growing at a 4.89% CAGR, supported by robust downstream plastics and elastomer capacity additions. China dominates regional demand, and Nouryon's November 2024 expansion in Ningbo doubled the output of Perkadox 14 and Trigonox 101 to 6,000 tons, underscoring local appetite for controlled rheology modifiers.
North America is characterized by mature but value-added demand in automotive composites, healthcare, and high-purity semiconductor polymers. Producers emphasize safer formulations, and several have introduced emulsion-based initiators that align with stricter Department of Transportation guidelines on bulk peroxide transport.
Europe trails closely, with growth driven by environmental legislation that restricts VOC emissions and mandates safer carriage of dangerous goods. The ADR update, effective in 2025, imposes tighter storage segregation and training requirements, increasing operating costs but encouraging the adoption of paste and polymer-bound forms.