솔라 컨테이너 시장 : 설치 유형별, 컴포넌트별, 출력 용량별, 유형별, 용도별, 지역별 - 예측(-2030년)
Solar Container Market by Installation Type, Type, Power Capacity, Component, Application and Region - Global Forecast to 2030
상품코드:1830046
리서치사:MarketsandMarkets
발행일:2025년 09월
페이지 정보:영문 255 Pages
라이선스 & 가격 (부가세 별도)
ㅁ Add-on 가능: 고객의 요청에 따라 일정한 범위 내에서 Customization이 가능합니다. 자세한 사항은 문의해 주시기 바랍니다.
한글목차
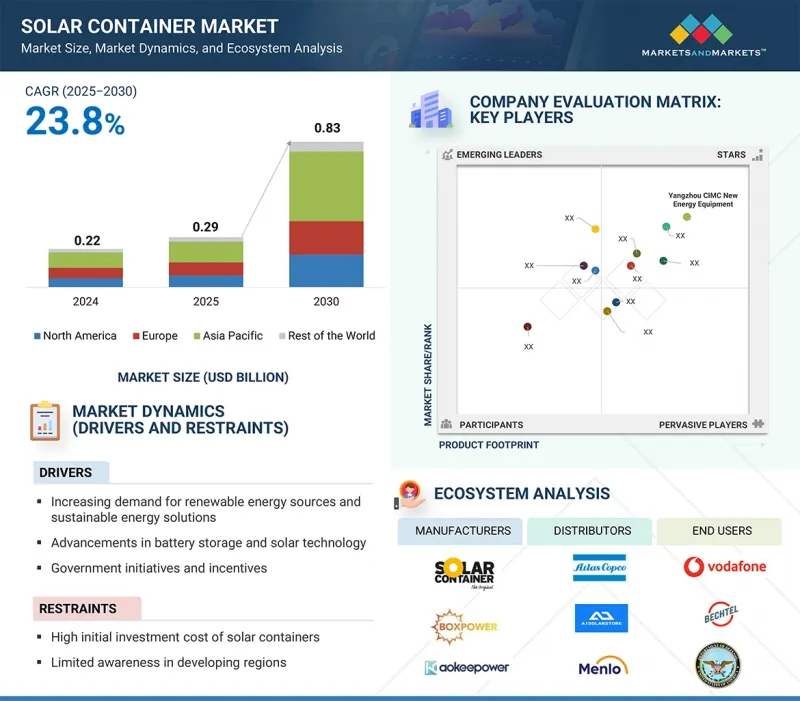
솔라 컨테이너 시장 규모는 2025년에 2억 9,000만 달러에 이르고, 예측 기간 중 연평균 복합 성장률(CAGR)은 23.8%로, 2030년에는 8억 3,000만 달러에 이를 것으로 예측됩니다.
이 시장은 신뢰할 수 있는 독립형 전력 공급에 대한 수요 증가, 휴대용 재생에너지 시스템 채택 증가, 지속 가능한 전력 접근에 대한 관심 증가 등을 배경으로 각 지역에서 강력한 성장세를 보이고 있습니다.
조사 범위
조사 대상 연도
2021-2030년
기준연도
2024년
예측 기간
2025-2030년
검토 단위
금액(10억 달러)
부문별
설치 유형별, 컴포넌트별, 출력 용량별, 유형별, 용도별, 지역별
대상 지역
북미, 유럽, 아시아태평양, 기타 지역
청정 에너지 보급을 촉진하기 위한 정부의 이니셔티브와 재해에 강한 농촌의 전기화를 목표로 하는 프로그램은 태양열 컨테이너의 채택을 더욱 가속화하고 있습니다. 이러한 솔루션은 무배출 전력을 공급하고, 에너지 안보를 강화하며, 화석연료 의존도를 낮추고, 기후 변화에 강한 인프라를 지원하는 데 중요한 역할을 하고 있습니다. 컨테이너형 태양광 시스템은 재난 구호 활동, 군용 전력 공급, 농촌 지역 전기화, 건설 현장의 에너지 공급 등의 용도로 전 세계적으로 널리 사용되고 있습니다.
50kW 이상 부문은 대규모 상업 및 산업 프로젝트에 대한 적합성, 지역 전기화 프로젝트에서의 채택 증가, 더 큰 용량의 하이브리드 재생 가능 시스템에 대한 수요 증가로 인해 예측 기간 동안 전력 용량 기준으로 두 번째로 큰 시장 규모를 차지할 것으로 예측됩니다. 대용량 솔라 컨테이너는 광산 현장, 건설 프로젝트, 제조 시설 등의 대규모 에너지 수요를 효율적으로 충족시킬 수 있기 때문에 대규모 상업 및 산업 사업에서 도입이 증가하고 있으며, 이 분야에서의 채택이 확대되고 있습니다. 또한, 지역 사회 전기화 프로젝트에서의 역할 확대도 수요를 가속화하고 있습니다. 50kW 이상의 시스템은 마을 전체, 학교, 의료 센터에 전력을 공급할 수 있는 능력을 갖추고 있어 농촌 개발 이니셔티브에 필수적인 역할을 하고 있습니다. 또한, 태양광 발전과 축전 및 백업 발전이 결합된 하이브리드 재생에너지 시스템을 통합하여 안정적인 전력 공급을 보장합니다. 이러한 장점은 종합적으로 50kW 이상 부문의 역할을 강화하여 예측 기간 동안 솔라 컨테이너 시장에서 두 번째로 큰 시장 규모를 확보할 수 있도록 합니다.
"용도별로는 농업 및 관개 분야가 예측 기간 동안 가장 높은 CAGR을 나타낼 것으로 예측됩니다.
용도별로는 농업 및 관개 분야가 태양광 관개 시스템에 대한 의존도 증가, 농업의 지속 가능한 에너지에 대한 수요 증가, 태양광 기반 농업에 대한 정부 지원 증가 등으로 인해 예측 기간 동안 가장 높은 CAGR을 나타낼 것으로 예측됩니다. 농부들은 연료비를 절감하고 안정적인 물 공급을 보장하며 작물 수확량을 향상시키기 위해 태양열 관개 시스템을 빠르게 도입하고 있으며, 농촌 지역 전체에서 도입이 가속화되고 있습니다. 또한, 농업은 에너지 집약적인 분야이며, 지속 가능한 농업에 대한 요구가 증가함에 따라 깨끗하고 비용 효율적이며 친환경적인 전력 솔루션을 제공하는 솔라 컨테이너에 대한 수요가 증가하고 있습니다. 또한, 보조금, 금융 혜택, 농촌 전기화 프로그램 등 정부의 강력한 지원은 태양광 기술을 보다 저렴하고 쉽게 이용할 수 있게 해주기 때문에 다른 용도에 비해 훨씬 빠른 속도로 도입이 가속화되고 있습니다. 이러한 요인으로 인해 농업 및 관개는 예측 기간 동안 솔라 컨테이너 시장에서 가장 빠르게 성장하는 응용 분야로 자리매김하고 있습니다.
북미 시장은 탄력적인 독립형 전력 솔루션에 대한 수요 증가, 재난 구조 및 비상 관리 분야에서 솔라 컨테이너의 보급 확대, 전기자동차를 위한 재생에너지 충전 인프라의 채택 증가로 인해 예측 기간 동안 두 번째로 높은 CAGR을 나타낼 것으로 예측됩니다. 전기자동차는 이동성이 뛰어나고 의료시설, 통신 시스템, 구조 활동 등 중요한 용도에 즉각적으로 전력을 공급할 수 있어 재난 구호 및 긴급 상황 관리에 매우 효과적이며, 그 활용이 더욱 가속화되고 있습니다. 또한, 북미의 전기자동차 보급은 지속 가능한 오프 그리드 충전 솔루션에 대한 강력한 수요를 창출하고 있으며, 태양열 컨테이너는 재생에너지 충전 인프라를 구축하는 데 중요한 역할을 하고 있습니다. 이러한 요인으로 인해 시장은 크게 성장하고 있으며, 북미는 예측 기간 동안 두 번째로 높은 CAGR을 기록한 지역입니다.
세계의 솔라 컨테이너 시장에 대해 조사했으며, 설치 유형별/구성요소별/출력 용량별/유형별/용도별/지역별 동향, 시장 진출기업 프로파일 등의 정보를 정리하여 전해드립니다.
목차
제1장 서론
제2장 조사 방법
제3장 주요 요약
제4장 프리미엄 인사이트
제5장 시장 개요
서론
시장 역학
고객의 비즈니스에 영향을 미치는 동향/혼란
가격 분석
밸류체인 분석
생태계 분석
기술 분석
특허 분석
무역 분석
2025-2026년 주요 컨퍼런스 및 이벤트
사례 연구 분석
투자 및 자금조달 시나리오
규제 상황
Porter의 Five Forces 분석
주요 이해관계자와 구입 기준
AI/생성형 AI가 솔라 컨테이너 시장에 미치는 영향
2025년 미국 관세가 솔라 컨테이너 시장에 미치는 영향
제6장 솔라 컨테이너 시장(설치 유형별)
서론
On-grid
Off-grid
제7장 솔라 컨테이너 시장(컴포넌트별)
서론
태양전지판
배터리
모니터링 시스템
인버터
에너지 관리 시스템
기타
제8장 솔라 컨테이너 시장(출력 용량별)
서론
10kW 이하
10kW-50kW
50kW 이상
제9장 솔라 컨테이너 시장(유형별)
서론
가동식
고정식
제10장 솔라 컨테이너 시장(용도별)
서론
농업 및 관개
원격 충전소
광업 및 군
에너지 기업
기타
제11장 솔라 컨테이너 시장(지역별)
서론
북미
북미의 거시경제 전망
미국
캐나다
멕시코
유럽
유럽 : 거시경제 전망
영국
독일
프랑스
이탈리아
스페인
폴란드
북유럽
기타
아시아태평양
아시아태평양 : 거시경제 전망
중국
일본
인도
한국
호주
인도네시아
말레이시아
태국
베트남
기타
기타 지역
기타 지역 : 거시경제 전망
중동
제12장 경쟁 구도
개요
주요 시장 진출기업의 전략/강점, 2021년-2025년
시장 점유율 분석, 2024년
브랜드/제품 비교
기업 평가 매트릭스 : 주요 시장 진출기업, 2024년
기업 평가 매트릭스 : 스타트업/중소기업, 2024년
경쟁 시나리오
제13장 기업 개요
서론
주요 시장 진출기업
YANGZHOU CIMC NEW ENERGY EQUIPMENT CO. LTD.
ECOSUN INNOVATIONS
FABER INFRASTRUCTURE GMBH
BOXPOWER INC.
HACON CONTAINERS
STATCON ENERGIAA PVT. LTD.
STATCON POWTECH PVT. LTD.
SOLARCONT GMBH
ALUMERO SYSTEMATIC SOLUTIONS GMBH
ERM ENERGIES
TELLCO EUROPE SAGL
INTECH GMBH & CO. KG
WILMOT MODULAR STRUCTURES, INC.
AFRICA GREENTEC
IYSERT ENERGY
기타 기업
GC SOLAR
RENEWABLE FUTURE(PTY) LTD.
INDEPENDENT ENERGY
HCI ENERGY, INC.
OFF-GRID EUROPE
ROXBOX CONTAINERS
AOKE EPOWER
SUNNYCAL SOLAR
SUSTAINSOLAR
CREACAR
RPS SOLAR PUMPS
제14장 부록
LSH
영문 목차
영문목차
The solar container market is estimated to be USD 0.29 billion in 2025 and is projected to reach USD 0.83 billion by 2030, at a CAGR of 23.8% during the forecast period. The market is experiencing robust growth across regions, driven by the rising need for reliable off-grid power supply, the increasing adoption of portable renewable energy systems, and the growing focus on sustainable electricity access.
Scope of the Report
Years Considered for the Study
2021-2030
Base Year
2024
Forecast Period
2025-2030
Units Considered
Value (USD Billion)
Segments
By Component, Type, Installation Type, Power Capacity, Application, and Region
Regions covered
North America, Europe, APAC, RoW
Government initiatives promoting clean energy deployment and programs aimed at disaster resilience and rural electrification further accelerate the adoption of solar containers. These solutions play a crucial role in providing emission-free power, enhancing energy security, reducing reliance on fossil fuels, and supporting climate-resilient infrastructure. Containerized solar systems are being widely utilized for applications such as disaster relief operations, military power supply, rural community electrification, and energy provision at construction sites worldwide.
"Based on power capacity, the above 50 kW segment is estimated to account for the second-largest market size during the forecast period."
The above 50 kW segment is expected to hold the second-largest market size, by power capacity, during the forecast period due to its suitability for large-scale commercial and industrial operations, rising adoption in community electrification projects, and growing demand for hybrid renewable systems with higher capacity. High-capacity solar containers are increasingly being deployed in large-scale commercial and industrial operations, as they can efficiently meet the heavy energy needs of mining sites, construction projects, and manufacturing facilities, driving strong adoption in this segment. In addition, their growing role in community electrification projects is accelerating demand, as above 50 kW systems have the ability to power entire villages, schools, and healthcare centers, making them vital for rural development initiatives. Furthermore, the integration of hybrid renewable systems, combining solar with storage and backup generation, ensures a reliable and continuous power supply, which is especially critical for industrial facilities and community projects operating around the clock. These advantages collectively strengthen the role of the above 50 kW segment, enabling it to capture the second-largest market size in the solar container market during the forecast period.
"Based on application, the agriculture & irrigation segment is projected to exhibit the highest CAGR during the forecast period."
By application, the agriculture & irrigation segment is expected to witness the highest CAGR during the forecast period due to increasing reliance on solar-powered irrigation systems, rising need for sustainable energy in farming, and growing government support for solar-based agricultural initiatives. Farmers are rapidly adopting solar-powered irrigation systems as they cut fuel costs, ensure a reliable water supply, and boost crop yields, leading to faster adoption across rural regions. Moreover, agriculture is an energy-intensive sector, and the rising need for sustainable farming is pushing demand for solar containers, which provide clean, cost-effective, and environmentally friendly power solutions. In addition, strong government support in the form of subsidies, financial incentives, and rural electrification programs is making solar technologies more affordable and accessible, thereby accelerating adoption at a much faster pace compared to other applications. These factors collectively position agriculture & irrigation as the fastest-growing application segment in the solar container market during the forecast period.
"North America is projected to register the second-highest CAGR during the forecast period."
The North American market is expected to witness the second-highest CAGR during the forecast period due to rising demand for resilient off-grid power solutions, growing deployment of solar containers in disaster relief and emergency management, and increasing adoption of renewable-powered charging infrastructure for electric vehicles. Their quick mobility and ability to provide immediate power for critical applications such as medical facilities, communication systems, and rescue operations make them highly effective in disaster relief and emergency management, further accelerating their use. Additionally, the expansion of electric vehicles in North America is creating strong demand for sustainable, off-grid charging solutions, where solar containers play a vital role in establishing renewable-powered charging infrastructure. These factors are driving significant market growth, making North America the region with the second-highest CAGR during the forecast period.
Extensive primary interviews were conducted with key industry experts in the solar container market to determine and verify the market size for various segments and subsegments gathered through secondary research. The breakdown of primary participants for the report is shown below.
The study contains insights from various industry experts, from component suppliers to Tier 1 companies and OEMs. The break-up of the primaries is as follows:
By Company Type - Tier 1 - 55%, Tier 2 - 25%, and Tier 3 - 20%
By Designation - Directors - 50%, Managers - 30%, and Others - 20%
By Region - North America - 45%, Europe - 30%, Asia Pacific - 20%, and Rest of the World - 5%
The solar container market is dominated by a few globally established players, such as Yangzhou CIMC New Energy Equipment Co., Ltd. (China), Ecosun Innovations (France), Faber Infrastructure GmbH (Germany), BoxPower Inc. (US), Hacon Containers (Netherlands), Statcon Powtech Pvt. Ltd. (India), SolarCont GmbH (Germany), Statcon Energiaa Pvt. Ltd. (India), ERM Energies (India), ALUMERO Systematic Solutions GmbH (Austria), IYSERT ENERGY (India), TellCo Europe Sagl (Switzerland), Intech GmbH & Co. KG (Germany), Wilmot Modular Structures, Inc. (US), and Africa GreenTec (Germany), GC Solar (South Africa), Renewable Future Pty Ltd (Australia), Independent Energy (Netherlands), and HCI Energy, Inc. (US).
The study includes an in-depth competitive analysis of these key players in the solar container market, with their company profiles, recent developments, and key market strategies.
Study Coverage:
The report segments the solar container market and forecasts its size by component (Solar Panels, Batteries, Monitoring Systems, Inverters, Energy Management Systems, Other Components), type (Portable, Fixed), installation type (On-grid, Off-grid), power capacity (Below 10 kW, 10 kW-50 kW, Above 50 kW), and application (Agriculture & Irrigation, Remote Charging Stations, Mining & Military, Energy Companies, Other Applications). It also discusses the market's drivers, restraints, opportunities, and challenges. It gives a detailed view of the market across four main regions (North America, Europe, Asia Pacific, and Rest of the World). The report includes a value chain analysis of the key players and their competitive analysis in the solar container ecosystem.
Key Benefits of Buying the Report:
Analysis of key drivers (Increasing demand for renewable energy sources and sustainable energy solutions, Advancements in battery storage and solar technology, Government Initiatives and Incentives), restraints (High initial investment cost of solar container, Limited awareness in developing regions), opportunities (Integration with smart energy management system, Growing demand from EV sector), challenges (Unstable power supply and battery limitations, Durability and maintenance in extreme environments)
Product Development/Innovation: Detailed insights on upcoming technologies, research and development activities, and new product launches in the solar container market
Market Development: Comprehensive information about lucrative markets - the report analyses the solar container market across varied regions
Market Diversification: Exhaustive information about new products, untapped geographies, recent developments, and investments in the solar container market
Competitive Assessment: In-depth assessment of market shares and growth strategies of leading players, such as Yangzhou CIMC New Energy Equipment Co., Ltd. (China), Ecosun Innovations (France), Faber Infrastructure GmbH (Germany), BoxPower Inc. (US), Hacon Containers (Netherlands), Statcon Powtech Pvt. Ltd. (India), SolarCont GmbH (Germany), Statcon Energiaa Pvt. Ltd. (India), ERM Energies (India), ALUMERO Systematic Solutions GmbH (Austria), IYSERT ENERGY (India), TellCo Europe Sagl (Switzerland), Intech GmbH & Co. KG (Germany), Wilmot Modular Structures, Inc. (US), and Africa GreenTec (Germany), GC Solar (South Africa), Renewable Future Pty Ltd (Australia), Independent Energy (Netherlands), and HCI Energy, Inc. (US)
TABLE OF CONTENTS
1 INTRODUCTION
1.1 STUDY OBJECTIVES
1.2 MARKET DEFINITION
1.3 STUDY SCOPE
1.3.1 MARKETS COVERED AND REGIONAL SCOPE
1.3.2 INCLUSIONS AND EXCLUSIONS
1.3.3 YEARS CONSIDERED
1.4 CURRENCY CONSIDERED
1.5 UNITS CONSIDERED
1.6 STAKEHOLDERS
2 RESEARCH METHODOLOGY
2.1 RESEARCH DATA
2.1.1 SECONDARY DATA
2.1.1.1 List of key secondary sources
2.1.1.2 Key data from secondary sources
2.1.2 PRIMARY DATA
2.1.2.1 List of primary interview participants
2.1.2.2 Breakdown of primary interviews
2.1.2.3 Key data from primary sources
2.1.2.4 Key industry insights
2.1.3 SECONDARY AND PRIMARY RESEARCH
2.2 MARKET SIZE ESTIMATION
2.2.1 BOTTOM-UP APPROACH
2.2.1.1 Approach to arrive at market size using bottom-up analysis (demand side)
2.2.2 TOP-DOWN APPROACH
2.2.2.1 Approach to arrive at market size using top-down analysis (supply side)
2.3 FACTOR ANALYSIS
2.3.1 DEMAND-SIDE ANALYSIS
2.3.2 SUPPLY-SIDE ANALYSIS
2.4 MARKET BREAKDOWN AND DATA TRIANGULATION
2.5 RESEARCH ASSUMPTIONS
2.6 RISK ASSESSMENT
2.7 RESEARCH LIMITATIONS
3 EXECUTIVE SUMMARY
4 PREMIUM INSIGHTS
4.1 ATTRACTIVE OPPORTUNITIES FOR PLAYERS IN SOLAR CONTAINER MARKET
4.2 SOLAR CONTAINER MARKET, BY TYPE
4.3 SOLAR CONTAINER MARKET, BY COMPONENT
4.4 SOLAR CONTAINER MARKET, BY APPLICATION
4.5 SOLAR CONTAINER MARKET, BY REGION
4.6 SOLAR CONTAINER MARKET, BY COUNTRY
5 MARKET OVERVIEW
5.1 INTRODUCTION
5.2 MARKET DYNAMICS
5.2.1 DRIVERS
5.2.1.1 Increasing demand for renewable energy sources and sustainable energy solutions
5.2.1.2 Advancements in battery storage and solar technology
5.2.1.3 Government initiatives and incentives encourage adoption of portable solar solutions
5.2.2 RESTRAINTS
5.2.2.1 High initial investment costs of solar containers
5.2.2.2 Limited awareness in developing regions leads to slow adoption
5.2.3 OPPORTUNITIES
5.2.3.1 Integration with smart energy management system
5.2.3.2 Growing demand from EV sector
5.2.4 CHALLENGES
5.2.4.1 Unstable power supply and battery limitations
5.2.4.2 Durability and maintenance in extreme environments
5.3 TRENDS/DISRUPTIONS IMPACTING CUSTOMER BUSINESS
5.4 PRICING ANALYSIS
5.4.1 AVERAGE SELLING PRICE TREND OF SOLAR CONTAINER POWER CAPACITIES, BY KEY PLAYER, 2024
5.4.2 AVERAGE SELLING PRICE TREND, BY REGION, 2021-2024
5.5 VALUE CHAIN ANALYSIS
5.6 ECOSYSTEM ANALYSIS
5.7 TECHNOLOGY ANALYSIS
5.7.1 KEY TECHNOLOGIES
5.7.1.1 Collapsible PV Modules
5.7.2 COMPLEMENTARY TECHNOLOGIES
5.7.2.1 Energy Storage Systems (ESS)
5.7.3 ADJACENT TECHNOLOGIES
5.7.3.1 Hydrogen Fuel Cells
5.8 PATENT ANALYSIS
5.9 TRADE ANALYSIS
5.9.1 IMPORT SCENARIO (HS CODE 8541)
5.9.2 EXPORT SCENARIO (HS CODE 8541)
5.10 KEY CONFERENCES AND EVENTS, 2025-2026
5.11 CASE STUDY ANALYSIS
5.11.1 INNOVATIVE SOLAR CONTAINERS FOR OFF-GRID ENERGY SOLUTIONS
5.11.2 SOLAR CONTAINERS FOR DISASTER RELIEF AND EMERGENCY RESPONSE
5.11.3 SOLAR CONTAINERS FOR RURAL ELECTRIFICATION AND COMMUNITY DEVELOPMENT
5.12 INVESTMENT AND FUNDING SCENARIO
5.13 REGULATORY LANDSCAPE
5.13.1 REGULATORY BODIES, GOVERNMENT AGENCIES, AND OTHER ORGANIZATIONS
5.14 PORTER'S FIVE FORCES ANALYSIS
5.14.1 THREATS OF NEW ENTRANTS
5.14.2 THREATS OF SUBSTITUTES
5.14.3 BARGAINING POWER OF SUPPLIERS
5.14.4 BARGAINING POWER OF BUYERS
5.14.5 INTENSITY OF COMPETITIVE RIVALRY
5.15 KEY STAKEHOLDERS AND BUYING CRITERIA
5.15.1 KEY STAKEHOLDERS IN BUYING PROCESS
5.15.2 BUYING CRITERIA
5.16 IMPACT OF AI/GEN AI ON SOLAR CONTAINER MARKET
5.17 IMPACT OF 2025 US TARIFFS ON SOLAR CONTAINER MARKET
5.17.1 INTRODUCTION
5.17.2 KEY TARIFF RATES
5.17.3 PRICE IMPACT ANALYSIS
5.17.4 IMPACT ON COUNTRIES/REGIONS
5.17.4.1 US
5.17.4.2 Europe
5.17.4.3 Asia Pacific
5.17.5 IMPACT ON END-USER INDUSTRIES
6 SOLAR CONTAINER MARKET, BY INSTALLATION TYPE
6.1 INTRODUCTION
6.2 ON-GRID
6.2.1 GROWING DEMAND FOR CLEAN ENERGY AND GRID INTEGRATION TO DRIVE MARKET
6.3 OFF-GRID
6.3.1 RISING DEMAND FOR RELIABLE POWER IN REMOTE AND OFF-GRID AREAS TO DRIVE MARKET
7 SOLAR CONTAINER MARKET, BY COMPONENT
7.1 INTRODUCTION
7.2 SOLAR PANELS
7.2.1 ADVANCEMENTS IN SOLAR PANELS TO DRIVE MARKET
7.3 BATTERIES
7.3.1 ENHANCED BATTERY STORAGE TO POWER MARKET GROWTH
7.4 MONITORING SYSTEMS
7.4.1 SMART MONITORING SYSTEMS TO ENHANCE EFFICIENCY IN MARKET
7.5 INVERTERS
7.5.1 ADVANCEMENTS IN INVERTER TECHNOLOGY TO DRIVE EFFICIENCY IN SOLAR CONTAINER MARKET
7.6 ENERGY MANAGEMENT SYSTEMS
7.6.1 SMART ENERGY MANAGEMENT SYSTEMS TO POWER FUTURE OF SOLAR CONTAINER SOLUTIONS
7.7 OTHER COMPONENTS
8 SOLAR CONTAINER MARKET, POWER CAPACITY
8.1 INTRODUCTION
8.2 BELOW 10 KW
8.2.1 RISING DEMAND FOR PORTABLE AND LOW-COST ENERGY SOLUTIONS TO BOOST SEGMENT
8.3 10 KW-50 KW
8.3.1 RURAL ELECTRIFICATION TO FUEL MID-CAPACITY SOLAR CONTAINER MARKET
8.4 ABOVE 50 KW
8.4.1 RISING DEMAND FOR RELIABLE AND SCALABLE OFF-GRID POWER SOLUTIONS TO PROPEL MARKET GROWTH
9 SOLAR CONTAINER MARKET, BY TYPE
9.1 INTRODUCTION
9.2 PORTABLE 115 9.2.1 RISING ADOPTION OF PORTABLE SOLAR CONTAINERS FOR FLEXIBLE AND SUSTAINABLE OFF-GRID POWER SOLUTIONS TO DRIVE MARKET
9.3 FIXED
9.3.1 FIXED SOLAR CONTAINERS ENABLING LONG-TERM, RELIABLE RENEWABLE ENERGY SOLUTIONS TO DRIVE MARKET
10 SOLAR CONTAINER MARKET, APPLICATION
10.1 INTRODUCTION
10.2 AGRICULTURE & IRRIGATION
10.2.1 RISING DEMAND FOR SUSTAINABLE IRRIGATION TO DRIVE MARKET
10.3 REMOTE CHARGING STATIONS
10.3.1 EXPANDING E-MOBILITY INFRASTRUCTURE AND OFF-GRID ENERGY DEMAND TO PROPEL MARKET
10.4 MINING & MILITARY
10.4.1 HIGH ENERGY COSTS AND NEED FOR RESILIENT POWER TO DRIVE SOLAR CONTAINER ADOPTION
10.5 ENERGY COMPANIES
10.5.1 DECENTRALIZED ELECTRIFICATION AND RENEWABLE INTEGRATION TO FUEL MARKET
10.6 OTHER APPLICATIONS
11 SOLAR CONTAINER MARKET, BY REGION
11.1 INTRODUCTION
11.2 NORTH AMERICA
11.2.1 MACROECONOMIC OUTLOOK IN NORTH AMERICA
11.2.2 US
11.2.2.1 Rising demand for resilient off-grid power solutions and government incentives to drive market
11.2.3 CANADA
11.2.3.1 Rising need for sustainable power solutions in remote & off-grid regions to propel market growth
11.2.4 MEXICO
11.2.4.1 Rising demand for decentralized power solutions and rural electrification to drive market
11.3 EUROPE
11.3.1 EUROPE: MACROECONOMIC OUTLOOK
11.3.2 UK
11.3.2.1 Growing adoption of solar container solutions in off-grid applications, temporary events, and defense operations to drive market
11.3.3 GERMANY
11.3.3.1 Increasing demand for decentralized energy to propel market growth
11.3.4 FRANCE
11.3.4.1 Government decarbonization goals and defense adoption to drive market
11.3.5 ITALY
11.3.5.1 Increasing focus on disaster resilience and rural electrification to drive market
11.3.6 SPAIN
11.3.6.1 Rising need for strong renewable energy targets and disaster relief to drive solar container growth
11.3.7 POLAND
11.3.7.1 Rising energy security concerns and off-grid electrification to drive solar container deployment
11.3.8 NORDICS
11.3.8.1 Need for strong sustainability policies and remote deployment to accelerate solar container market growth
11.3.9 REST OF EUROPE
11.4 ASIA PACIFIC
11.4.1 ASIA PACIFIC: MACROECONOMIC OUTLOOK
11.4.2 CHINA
11.4.2.1 Growing renewable energy investments and off-grid power demand to drive market
11.4.3 JAPAN
11.4.3.1 Rising demand for renewable energy, disaster resilience, and advanced off-grid solutions to drive market
11.4.4 INDIA
11.4.4.1 Rising demand for decentralized renewable energy and disaster-resilient power solutions to drive market
11.4.5 SOUTH KOREA
11.4.5.1 Rising demand for renewable energy integration and resilient off-grid power solutions to drive market
11.4.6 AUSTRALIA
11.4.6.1 Growing demand for resilient off-grid power and mining & remote-site electrification to drive market
11.4.7 INDONESIA
11.4.7.1 Rising need for rural electrification, disaster resilience, and renewable integration to drive market
11.4.8 MALAYSIA
11.4.8.1 Growing demand from both rural electrification programs and industrial users to fuel market
11.4.9 THAILAND
11.4.9.1 Expanding renewable energy targets, rural electrification, and tourism sector resilience to drive market
11.4.10 VIETNAM
11.4.10.1 Growing coastal community needs and increasing developer interest to propel market
11.4.11 REST OF ASIA PACIFIC
11.5 ROW
11.5.1 ROW: MACROECONOMIC OUTLOOK
11.5.2 MIDDLE EAST
11.5.2.1 Bahrain
11.5.2.1.1 Government renewable energy targets and sustainability goals to drive solar container adoption
11.5.2.2 Kuwait
11.5.2.2.1 Rising renewable energy commitments and remote power needs to fuel solar container adoption
11.5.2.3 Oman
11.5.2.3.1 Expanding renewable energy goals and remote-site electrification to drive market
11.5.2.4 Qatar
11.5.2.4.1 Renewable energy commitments and infrastructure expansion to drive market
11.5.2.5 Saudi Arabia
11.5.2.5.1 Rising demand for resilient off-grid solutions and large-scale investment to drive market
11.5.2.6 UAE
11.5.2.6.1 Growing corporate demand for flexible energy systems to fuel market growth
11.5.2.7 Rest of Middle East
11.5.2.8 Africa
11.5.2.9 South America
12 COMPETITIVE LANDSCAPE
12.1 OVERVIEW
12.2 KEY PLAYER STRATEGIES/RIGHT TO WIN, 2021-2025
12.3 MARKET SHARE ANALYSIS, 2024
12.4 BRAND/PRODUCT COMPARISON
12.5 COMPANY EVALUATION MATRIX: KEY PLAYERS, 2024
12.5.1 STARS
12.5.2 EMERGING LEADERS
12.5.3 PERVASIVE PLAYERS
12.5.4 PARTICIPANTS
12.5.5 COMPANY FOOTPRINT: KEY PLAYERS, 2024
12.5.5.1 Company footprint
12.5.5.2 Region footprint
12.5.5.3 Type footprint
12.5.5.4 Power capacity footprint
12.5.5.5 Application footprint
12.6 COMPANY EVALUATION MATRIX: STARTUPS/SMES, 2024