탄소 포집, 활용 및 저장 시장 : 서비스별, 기술별, 최종 이용 산업별, 지역별 예측(-2030년)
Carbon Capture, Utilization, and Storage Market by Service, Technology, End-use Industry, and Region - Global Forecast to 2030
상품코드:1811750
리서치사:MarketsandMarkets
발행일:2025년 09월
페이지 정보:영문 318 Pages
라이선스 & 가격 (부가세 별도)
ㅁ Add-on 가능: 고객의 요청에 따라 일정한 범위 내에서 Customization이 가능합니다. 자세한 사항은 문의해 주시기 바랍니다.
한글목차
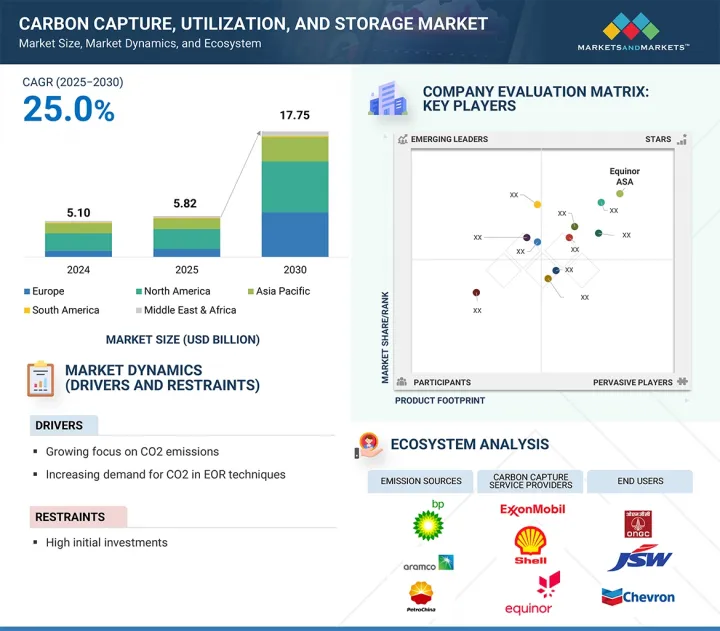
탄소 포집 및 활용 및 저류(CCUS) 시장 규모는 2025년에 58억 2,000만 달러로 추정되고, 25.0%의 연평균 성장률(CAGR)로 확대되고, 2030년에 177억 5,000만 달러에 이를 전망입니다.
포집 서비스는 CCUS 시장에서 가장 큰 비중을 기록됩니다. 이는 이산화탄소 포집이 가치 사슬에서 가장 도전적이고 자본 집약적이며 필수적인 단계이며, 어디에서나 활용 또는 저장 활동으로 이어지는 주요 관문이기 때문입니다. 가장 비용이 많이 드는 이 부문은 기존 산업 공정과의 통합은 물론, 연소 후 포집, 연소 전 포집, 산소 연료 등 특수 시스템 및 기술에 대한 막대한 투자를 필요로 합니다.
조사 범위
조사 대상 연도
2021-2030년
기준 연도
2024년
예측 기간
2025-2030년
검토 단위
금액(100만 달러) 및 킬로톤
부문
서비스별, 기술별, 최종 이용 산업별, 지역별
대상 지역
유럽, 북미, 아시아태평양, 중동, 아프리카, 남미
이처럼 포집 서비스 자체가 CCUS 부문에서 가장 높은 수익을 기록하며, 포집이 이루어지지 않으면 CCUS의 후속 단계가 시작될 수 없습니다. 따라서 발전, 시멘트, 철강, 화학 등 배출 목표와 규제를 충족하고 저탄소 인증을 획득하려는 산업에서 수요가 발생합니다.
화학 루핑은 기존 포집 공정에 비해 향상된 에너지 효율과 낮은 운영 비용을 통해 금속 산화물을 활용하여 연료 연소를 위한 산소를 운반함으로써, 매우 비싼 용매 재생 없이도 본질적으로 CO2를 분리하는 가장 빠르게 성장하는 기술입니다. 이것이 바로 해당 기술이 낮은 에너지 손실을 유지하고, 다양한 연료(석탄, 천연가스, 바이오매스 등) 통합을 가능하게 하며, 전력 및 산업용 수소와 같은 가치 있는 부산물을 공동 생산할 수 있는 경우에도 매력적인 이유입니다. R&D 및 파일럿에서 상용 규모 시연에서 극적인 성장이 있으며, 엄격한 탈탄소화 목표를 달성할 수 있는 능력은 전 세계 이 기술의 채택을 촉진하고 있습니다.
전력 생산 부문은 석탄 및 가스 화력 발전소가 전 세계 대규모 CO2 원이며, 강화되는 기후 정책과 탄소 중립 목표를 준수하기 위해 포집 장비로 개조하기에 가장 적합한 후보이기 때문에 CCUS 시장에서 두 번째로 빠르게 성장하는 최종 사용 부문입니다. 여러 정부는 전력 생산의 탈탄소화를 위해 상당한 인센티브, 세액 공제 및 자금 지원 방안을 제공하는 반면, 전력 사업자들은 기존 자산의 가동성을 유지하고 재생에너지와 함께 저탄소 기저 부하 전력을 공급하기 위해 CCUS에 투자하고 있습니다. 또한 발전 시설 내 CCUS의 대규모 활용은 즉각적이고 높은 수준의 배출 감축을 실현하여 발전 속도가 느린 산업 원에 비해 신속한 도입을 촉진합니다.
유럽은 EU 그린딜과 법적 구속력 있는 2050년 탄소중립 목표 등 적극적인 기후 정책 덕분에 CCUS 시장에서 두 번째로 높은 연평균 복합 성장률(연평균 성장률(CAGR))을 기록할 것으로 예상됩니다. 이러한 정책들은 전력, 시멘트, 철강, 화학 부문에서 대규모 탄소 포집 사업들의 전개를 촉구하고 있습니다. 이 지역은 강력한 국가 지원, EU 배출권 거래제(EU ETS)의 탄소 가격 책정, 포집, 운송 및 저장 시설을 결합한 노던 라이트(Northern Lights) 및 포토스(Porthos) 프로젝트와 같은 협력적 국경 간 프로젝트의 혜택을 받고 있습니다. 유럽의 확립된 산업 기반, 지원적인 규제 미래, 저탄소 혁신에 대한 집중은 CCUS의 폭발적 확장을 위한 비옥한 토양을 제공합니다.
본 보고서에서는 세계의 탄소 포집, 활용 및 저장 시장에 대해 조사했으며, 서비스별, 기술별, 최종 이용 산업별, 지역별 동향, 시장 진출기업 프로파일 등을 정리했습니다.
목차
제1장 서론
제2장 조사 방법
제3장 주요 요약
제4장 중요 인사이트
제5장 시장 개요
소개
시장 역학
Porter's Five Forces 분석
주요 이해관계자와 구매 기준
생태계 분석
가격 분석
밸류체인 분석
기술 분석
AI/생성형 AI가 CCUS 시장에 미치는 영향
거시경제 전망
특허 분석
규제 상황
주된 회의 및 이벤트(2025-2026년)
사례 연구 분석
고객사업에 영향을 주는 동향 및 혼란
투자 및 자금조달 시나리오
미국 관세의 영향(2025년) : 탄소 포집, 활용 및 저장 시장
제6장 탄소 포집, 활용 및 저장 시장(서비스별)
소개
포집
운송
활용
저장
제7장 탄소 포집, 활용 및 저장 시장(기술별)
소개
화학 루핑
용매 및 흡착제
막
기타
제8장 탄소 포집, 활용 및 저장 시장(최종 이용 산업별)
소개
석유 및 가스
발전
화학제품 및 석유화학제품
시멘트
철강
기타
제9장 탄소 포집, 활용 및 저장 시장(지역별)
소개
북미
미국
캐나다
멕시코
유럽
노르웨이
영국
프랑스
네덜란드
이탈리아
기타
아시아태평양
중국
일본
인도
호주
기타
중동 및 아프리카
GCC 국가
기타
남미
브라질
아르헨티나
기타
제10장 경쟁 구도
개요
주요 진입기업의 전략 및 강점
수익 분석(2020-2024년)
시장 점유율 분석(2024년)
브랜드, 제품 비교 분석
기업평가 매트릭스 : 주요 진입기업(2024년)
기업평가 매트릭스 : 스타트업, 중소기업(2024년)
평가 및 재무지표
경쟁 시나리오
제11장 기업 프로파일
주요 진출기업
FLUOR CORPORATION
EXXON MOBIL CORPORATION
SHELL PLC
EQUINOR ASA
TOTALENERGIES SE
LINDE PLC
MITSUBISHI HEAVY INDUSTRIES, LTD.
JGC HOLDINGS CORPORATION
SCHLUMBERGER LIMITED
AKER SOLUTIONS
HONEYWELL INTERNATIONAL
HITACHI, LTD.
SIEMENS AG
GE VERNOVA
HALLIBURTON
기타 시장 진출기업
CLIMEWORKS AG
CARBON CLEAN SOLUTIONS
OCCIDENTAL
GREEN MINERALS
CARBICRETE
CARBONFREE
SVANTE TECHNOLOGIES INC.
GREEN POWER INTERNATIONAL PVT. LTD.
WOLF MIDSTREAM
BABCOCK & WILCOX
제12장 신기술
미생물 전기합성(MES)
흡착 기술별 CO2 포집(흡착제로서 제올라이트 사용)
기타 신기술
제13장 부록
HBR
영문 목차
영문목차
The carbon capture, utilization, and storage (CCUS) market is estimated at USD 5.82 billion in 2025 and is projected to reach USD 17.75 billion by 2030, at a CAGR of 25.0%. Capture services account for the largest share of the CCUS market since capturing CO2 is the most challenging, capital-intensive, and essential step in the value chain, the primary gateway anywhere that leads to utilization or storage activity. This demand formulation, being the costliest segment, requires heavy investments in specialized systems and technologies, such as post-combustion, pre-combustion, and oxy-fuel, not to mention its integration into existing industrial processes.
Scope of the Report
Years Considered for the Study
2021-2030
Base Year
2024
Forecast Period
2025-2030
Units Considered
Value (USD Million) and Volume (Kiloton)
Segments
Service, Technology, End-use Industry, and Region
Regions covered
Europe, North America, Asia Pacific, the Middle East & Africa, and South America
That is how capture services themselves generate the highest revenues for the CCUS sectors, and since there is no capture, the subsequent stages in CCUS cannot commence; therefore, demand is generated by such industries as power generation, cement, steel, and chemicals seeking to meet emissions targets, regulations, and attain low-carbon labels.
"Chemical loop is projected to be the fastest-growing form during the forecast period."
Chemical looping is the fastest growing technology that, through the improved energy efficiency and low operation cost in comparison to conventional capture processes, utilizes metal oxides to shuttle oxygen for fuel combustion and thus inherently separates CO2 without using solvent regeneration, which is very expensive. This is the reason why the technologies maintain a lower energy penalty; allow the integration of various fuels (such as coal, natural gas, and biomass); and are even enticing in cases where they can co-produce some of the valuable outputs like hydrogen for both power and industrial applications. The propensity for dramatic growth witnessed in R&D and pilot-to-commercial scale demonstrations, as well as its ability to meet stringent decarbonization goals, catalyzes its global adoption.
"The power generation segment is projected to register the second-highest growth rate during the forecast period."
The power generation segment is the second fastest-growing end-use sector in the CCUS market due to coal and gas-fired plants being large global CO2 sources and best candidates for retrofitting with capture equipment to comply with tightening climate policies and net-zero targets. Several governments provide significant incentives, tax credits, and funding schemes for decarbonizing electricity generation, whereas utilities are making investments in CCUS to keep existing assets viable and facilitate low-carbon baseload power together with renewables. Moreover, large-scale utilization of CCUS within power facilities delivers instantaneous, high-level emission cuts, promoting quick uptake compared to slower-developing industrial sources.
"Europe is projected to register the second-highest growth rate in the CCUS market during the forecast period."
Europe is anticipated to record the second-highest CAGR within the CCUS market by virtue of its aggressive climate policies, such as the EU Green Deal and legally binding 2050 net-zero targets, which are urging massive deployment of carbon capture initiatives in the power, cement, steel, and chemical sectors. The area is favored by robust state support, carbon pricing in the EU Emissions Trading System, and cooperative cross-border projects such as the Northern Lights and Porthos ventures that combine capture, transport, and storage facilities. Europe's established industrial base, supportive regulatory landscape, and low-carbon innovation focus provide a fertile breeding ground for explosive CCUS expansion.
This study has been validated through primary interviews with industry experts globally. The primary sources have been divided into the following three categories:
By Company Type: Tier 1 - 40%; Tier 2 - 33%; and Tier 3 - 27%
By Designation: C-level - 50%; Director-level - 30%; and Managers - 20%
By Region: North America - 15%; Europe - 50%; Asia Pacific - 20%; the Middle East & Africa - 10%; and Latin America - 5%
The report provides a comprehensive analysis of the following companies:
Prominent companies in this market include Fluor Corporation (US), Exxon Mobil Corporation (US), Linde plc (UK), Shell Plc. (UK), Mitsubishi Heavy Industries, Ltd. (Japan), JGC Holdings Corporation (Japan), Schlumberger Limited (US), Aker Solutions (Norway), Honeywell International (US), Equinor ASA (Norway), TotalEnergies SE (France), Hitachi Ltd (Japan), Siemens AG (Germany), GE Vernova (US), and Halliburton (US).
Research Coverage
This research report categorizes the CCUS market by service (capture, utilization, storage, transportation), technology (chemical looping, solvents & sorbents, membranes, others), end-use industry (oil & gas, power generation, chemical & petrochemical, cement, iron & steel, other end-use industries), and region (North America, Europe, Asia Pacific, the Middle East & Africa, and South America). The scope of the report includes detailed information about the major factors influencing the growth of the CCUS market, such as drivers, restraints, challenges, and opportunities. A thorough examination of the key industry players has been conducted to provide insights into their business overview, solutions and services, key strategies, and recent developments in the CCUS market. This report includes a competitive analysis of upcoming startups in the CCUS market ecosystem.
Reasons to buy this report
The report will help market leaders/new entrants with information on the closest approximations of the revenue numbers for the overall CCUS market and the subsegments. This report will help stakeholders understand the competitive landscape and gain more insights to better position their businesses and plan suitable go-to-market strategies. The report also helps stakeholders understand the pulse of the market and provides them with information on key market drivers, restraints, challenges, and opportunities.
The report provides insights on the following pointers:
Analysis of key drivers (growing focus on CO2 emissions, increasing demand for CO2 in EOR techniques), restraints (high cost of carbon capture and sequestration), opportunities (large number of upcoming projects in Asia Pacific), and challenges (high initial investments) are influencing the growth of the CCUS market.
Product Development/Innovation: Detailed insights on upcoming technologies, research & development activities, and product launches in the CCUS market.
Market Development: Comprehensive information about lucrative markets-the report analyses the CCUS market across varied regions.
Market Diversification: Exhaustive information about services, untapped geographies, recent developments, and investments in the CCUS market.
Competitive Assessment: In-depth assessment of market shares, growth strategies, and product offerings of leading players like Fluor Corporation (US), Exxon Mobil Corporation (US), Linde plc (UK), Shell plc (UK), Mitsubishi Heavy Industries, Ltd. (Japan), JGC Holdings Corporation (Japan), Schlumberger Limited (US), Aker Solutions (Norway), Honeywell International (US), Equinor ASA (Norway), TotalEnergies SE (France), Hitachi Ltd (Japan), Siemens AG (Germany), GE Vernova (US), and Halliburton (US).
TABLE OF CONTENTS
1 INTRODUCTION
1.1 STUDY OBJECTIVES
1.2 MARKET DEFINITION
1.3 STUDY SCOPE
1.3.1 MARKETS COVERED AND REGIONS CONSIDERED
1.3.2 INCLUSIONS AND EXCLUSIONS
1.3.3 YEARS CONSIDERED
1.3.4 CURRENCY CONSIDERED
1.3.5 UNITS CONSIDERED
1.4 STAKEHOLDERS
1.5 SUMMARY OF CHANGES
2 RESEARCH METHODOLOGY
2.1 RESEARCH DATA
2.1.1 SECONDARY DATA
2.1.1.1 Key data from secondary sources
2.1.2 PRIMARY DATA
2.1.2.1 Key data from primary sources
2.1.2.2 Interviews with top service providers
2.1.2.3 Breakdown of primary interviews with experts
2.1.2.4 Key industry insights
2.2 BASE NUMBER CALCULATION
2.2.1 APPROACH 1: SUPPLY-SIDE APPROACH
2.2.2 APPROACH 2: DEMAND-SIDE APPROACH
2.3 GROWTH FORECAST
2.3.1 SUPPLY SIDE
2.3.2 DEMAND SIDE
2.4 MARKET SIZE ESTIMATION
2.4.1 BOTTOM-UP APPROACH
2.4.2 TOP-DOWN APPROACH
2.5 DATA TRIANGULATION
2.6 FACTOR ANALYSIS
2.7 RESEARCH ASSUMPTIONS
2.8 LIMITATIONS
3 EXECUTIVE SUMMARY
4 PREMIUM INSIGHTS
4.1 ATTRACTIVE OPPORTUNITIES FOR PLAYERS IN CARBON CAPTURE, UTILIZATION, AND STORAGE MARKET
4.2 CARBON CAPTURE, UTILIZATION, AND STORAGE MARKET BY END-USE INDUSTRY AND REGION
4.3 CARBON CAPTURE, UTILIZATION, AND STORAGE MARKET, BY SERVICE
4.4 CARBON CAPTURE, UTILIZATION, AND STORAGE MARKET, BY TECHNOLOGY
4.5 CARBON CAPTURE, UTILIZATION, AND STORAGE MARKET, BY END-USE INDUSTRY
4.6 CARBON CAPTURE, UTILIZATION, AND STORAGE MARKET, BY COUNTRY
5 MARKET OVERVIEW
5.1 INTRODUCTION
5.2 MARKET DYNAMICS
5.2.1 DRIVERS
5.2.1.1 Growing focus on reducing CO2 emissions
5.2.1.2 Increasing demand for CO2 in EOR techniques
5.2.1.3 Rising environmental awareness to increase natural gas demand
5.2.2 RESTRAINTS
5.2.2.1 High cost of carbon capture and storage
5.2.2.2 Safety concerns at storage sites
5.2.3 OPPORTUNITIES
5.2.3.1 Continuous investments in developing innovative capturing technologies
5.2.3.2 Large number of upcoming projects in APAC
5.2.3.3 Announcement of large-capacity hydrogen projects
5.2.4 CHALLENGES
5.2.4.1 Reducing CO2 capturing costs
5.2.4.2 Transparency & credibility risks: measurement errors, greenwashing, and lobbying
5.3 PORTER'S FIVE FORCES ANALYSIS
5.3.1 BARGAINING POWER OF SUPPLIERS
5.3.2 BARGAINING POWER OF BUYERS
5.3.3 THREAT OF SUBSTITUTES
5.3.4 THREAT OF NEW ENTRANTS
5.3.5 INTENSITY OF COMPETITIVE RIVALRY
5.4 KEY STAKEHOLDERS AND BUYING CRITERIA
5.4.1 KEY STAKEHOLDERS IN BUYING PROCESS
5.4.2 BUYING CRITERIA
5.5 ECOSYSTEM ANALYSIS
5.6 PRICING ANALYSIS
5.6.1 AVERAGE SELLING PRICE, BY KEY PLAYER
5.6.2 AVERAGE SELLING PRICE TREND, BY REGION
5.7 VALUE CHAIN ANALYSIS
5.8 TECHNOLOGY ANALYSIS
5.8.1 KEY TECHNOLOGIES
5.8.1.1 Direct Capture Technologies
5.8.1.1.1 Post-combustion Capture
5.8.1.1.2 Pre-combustion Capture
5.8.1.1.3 Oxy-fuel Combustion
5.8.1.1.4 Direct Air Capture
5.8.1.2 Transport Technologies
5.8.1.2.1 Pipeline
5.8.1.2.2 Ship-based
5.8.1.3 Utilization Technologies
5.8.1.3.1 Direct Utilization
5.8.1.3.2 Mineralization
5.8.2 COMPLEMENTARY TECHNOLOGIES
5.8.2.1 Gas Separation & Purification
5.8.2.2 Liquefaction & Phase Change Technologies
5.9 IMPACT OF AI/GEN AI ON CCUS MARKET
5.9.1 TOP USE CASES AND MARKET POTENTIAL
5.9.2 CASE STUDIES OF AI IMPLEMENTATION IN CCUS MARKET
5.10 MACROECONOMIC OUTLOOK
5.10.1 INTRODUCTION
5.10.2 GDP TRENDS AND FORECAST
5.10.3 TRENDS IN GLOBAL OIL & GAS INDUSTRY
5.11 PATENT ANALYSIS
5.11.1 INTRODUCTION
5.11.2 METHODOLOGY
5.11.3 PATENT TYPES
5.11.4 INSIGHTS
5.11.5 LEGAL STATUS
5.11.6 JURISDICTION ANALYSIS
5.11.7 TOP APPLICANTS
5.12 REGULATORY LANDSCAPE
5.12.1 REGULATORY BODIES, GOVERNMENT AGENCIES, AND OTHER ORGANIZATIONS
5.12.2 STANDARDS IN CARBON CAPTURE, UTILIZATION, AND STORAGE MARKET
5.13 KEY CONFERENCES AND EVENTS, 2025-2026
5.14 CASE STUDY ANALYSIS
5.14.1 CASE STUDY 1: SHELL QUEST CCS PROJECT
5.14.2 CASE STUDY 2: PETRA NOVA CARBON CAPTURE PROJECT
5.14.3 CASE STUDY 3: MITSUBISHI HEAVY INDUSTRIES PARTNERED WITH HEIDELBERG MATERIALS TO INTRODUCE CO2 CAPTURE TECHNOLOGIES IN CEMENT SECTOR
5.15 TRENDS/DISRUPTIONS IMPACTING CUSTOMER BUSINESS
5.16 INVESTMENT AND FUNDING SCENARIO
5.17 IMPACT OF 2025 US TARIFFS-CARBON, CAPTURE, UTILIZATION, AND STORAGE MARKET
5.17.1 INTRODUCTION
5.17.2 KEY TARIFF RATES
5.17.3 PRICE IMPACT ANALYSIS
5.17.4 IMPACT ON COUNTRIES/REGIONS
5.17.4.1 US
5.17.4.2 Europe
5.17.4.3 Asia Pacific
5.17.5 IMPACT ON END-USE INDUSTRIES
6 CARBON CAPTURE, UTILIZATION, AND STORAGE MARKET, BY SERVICE
6.1 INTRODUCTION
6.2 CAPTURE
6.2.1 CARBON CAPTURE TECHNOLOGIES
6.2.1.1 Post-combustion
6.2.1.1.1 Post-combustion offers high CO2 capture efficiency of 99%
6.2.1.2 Oxy-fuel
6.2.1.2.1 Simplified CO2 capture compared with conventional processes
6.2.1.3 Pre-combustion
6.2.1.3.1 Eliminates CO2 from gas stream before dilution with air or oxygen
6.2.1.4 Bio-energy CCS (BECCS)
6.2.1.4.1 Use of biomass to store carbon offers stability of more than 1,000 years
6.2.1.5 Direct Air Capture
6.2.1.5.1 Need for negative emission technology to promote development of DAC technology
6.3 TRANSPORTATION
6.3.1 PIPELINE TO BE MOST PREFERRED MODE OF CO2 TRANSPORTATION
6.4 UTILIZATION
6.4.1 EOR USING CO2 FROM CAPTURE PROCESSES TO INCREASE CO2 UTILIZATION
6.5 STORAGE
6.5.1 GEOLOGICAL STORAGE TO BE MOST PREFERRED METHOD OF CO2 STORAGE
6.5.2 STORAGE SERVICES, BY TECHNOLOGY
6.5.3 GEOLOGICAL STORAGE
6.5.3.1 Oil & gas reservoirs
6.5.3.1.1 Oil & gas reservoirs offer most efficient storage
6.5.3.2 Unmineable coal beds
6.5.3.2.1 Further research required to optimize storage in coal beds
6.5.3.3 Saline aquifers
6.5.3.3.1 Less knowledge about saline aquifers' features compared to other storage types
6.5.4 DEEP OCEAN STORAGE
6.5.4.1 Low preference over geological storage due to associated environmental risks
7 CARBON CAPTURE, UTILIZATION, AND STORAGE MARKET, BY TECHNOLOGY
7.1 INTRODUCTION
7.2 CHEMICAL LOOPING
7.2.1 COST-EFFECTIVENESS TO DRIVE ADOPTION OF CHEMICAL LOOPING
7.3 SOLVENTS & SORBENTS
7.3.1 HIGH CAPTURE RATE TO DRIVE DEMAND
7.4 MEMBRANES
7.4.1 HIGHLY EFFICIENT CARBON CAPTURE TECHNOLOGY
7.5 OTHER TECHNOLOGIES
8 CARBON CAPTURE, UTILIZATION, AND STORAGE MARKET, BY END-USE INDUSTRY
8.1 INTRODUCTION
8.2 OIL & GAS
8.2.1 CO2 MOSTLY EXTRACTED FROM NATURAL GAS PLANTS
8.3 POWER GENERATION
8.3.1 FOSSIL FUEL POWER PLANTS SIGNIFICANTLY CONTRIBUTE TO MARKET GROWTH
8.4 CHEMICAL & PETROCHEMICAL
8.4.1 AMMONIA PRODUCTION PLANTS CONTRIBUTE SIGNIFICANTLY TO MARKET
8.5 CEMENT
8.5.1 GOVERNMENT REGULATIONS FORCING CEMENT INDUSTRY TO ADOPT CARBON CAPTURE TECHNOLOGY
8.6 IRON & STEEL
8.6.1 STEEL INDUSTRY ACCOUNTS FOR LARGE SHARE OF ANTHROPOGENIC CO2 EMISSIONS
8.7 OTHER END-USE INDUSTRIES
9 CARBON CAPTURE, UTILIZATION, AND STORAGE MARKET, BY REGION
9.1 INTRODUCTION
9.2 NORTH AMERICA
9.2.1 US
9.2.1.1 Government support for implementation of CCUS to drive market
9.2.2 CANADA
9.2.2.1 Carbon storage projects to drive CCUS market
9.2.3 MEXICO
9.2.3.1 Need for transportation of carbon to offshore storage facilities to drive market
9.3 EUROPE
9.3.1 NORWAY
9.3.1.1 Increase in natural gas demand for power generation to drive market
9.3.2 UK
9.3.2.1 New regulations announced by government to boost CCUS market growth
9.3.3 FRANCE
9.3.3.1 Announcement of new projects to boost market
9.3.4 NETHERLANDS
9.3.4.1 Transportation segment to grow fast owing to CATO-2 project in Netherlands
9.3.5 ITALY
9.3.5.1 Government regulations to push market growth
9.3.6 REST OF EUROPE
9.4 ASIA PACIFIC
9.4.1 CHINA
9.4.1.1 Collaborations between Chinese government and companies and organizations to drive market
9.4.2 JAPAN
9.4.2.1 Availability of major technology providers and strong industrial base to support market growth
9.4.3 INDIA
9.4.3.1 Industrialization and emission regulations to drive market
9.4.4 AUSTRALIA
9.4.4.1 Transportation segment to witness high growth
9.4.5 REST OF ASIA PACIFIC
9.5 MIDDLE EAST & AFRICA
9.5.1 GCC COUNTRIES
9.5.1.1 UAE
9.5.1.1.1 Carbon utilization for EOR to drive market
9.5.1.2 Saudi Arabia
9.5.1.2.1 Growing number of CCUS projects to drive market
9.5.1.3 Rest of GCC Countries
9.5.2 REST OF MIDDLE EAST & AFRICA
9.6 SOUTH AMERICA
9.6.1 BRAZIL
9.6.1.1 Government initiatives to drive the market
9.6.2 ARGENTINA
9.6.2.1 Growing hydrocarbon sector to drive the market
9.6.3 REST OF SOUTH AMERICA
10 COMPETITIVE LANDSCAPE
10.1 OVERVIEW
10.2 KEY PLAYER STRATEGIES/RIGHT TO WIN
10.3 REVENUE ANALYSIS, 2020-2024
10.4 MARKET SHARE ANALYSIS, 2024
10.5 BRAND/PRODUCT COMPARATIVE ANALYSIS
10.6 COMPANY EVALUATION MATRIX: KEY PLAYERS, 2024
10.6.1 STARS
10.6.2 EMERGING LEADERS
10.6.3 PERVASIVE PLAYERS
10.6.4 PARTICIPANTS
10.6.5 COMPANY FOOTPRINT: KEY PLAYERS, 2024
10.7 COMPANY EVALUATION MATRIX: STARTUPS/SMES, 2024
10.7.1 PROGRESSIVE COMPANIES
10.7.2 RESPONSIVE COMPANIES
10.7.3 DYNAMIC COMPANIES
10.7.4 STARTING BLOCKS
10.7.5 COMPETITIVE BENCHMARKING OF KEY STARTUPS/SMES
10.7.5.1 Detailed list of key startups/SMEs
10.7.5.2 Competitive benchmarking of key startups/SMEs
10.8 VALUATION AND FINANCIAL METRICS
10.9 COMPETITIVE SCENARIO
10.9.1 DEALS
10.9.2 EXPANSIONS
11 COMPANY PROFILES
11.1 KEY PLAYERS
11.1.1 FLUOR CORPORATION
11.1.1.1 Business overview
11.1.1.2 Products offered
11.1.1.3 Recent developments
11.1.1.3.1 Deals
11.1.1.3.2 Other developments
11.1.1.4 MnM view
11.1.1.4.1 Right to win
11.1.1.4.2 Strategic choices
11.1.1.4.3 Weaknesses and competitive threats
11.1.2 EXXON MOBIL CORPORATION
11.1.2.1 Business overview
11.1.2.2 Products offered
11.1.2.3 Recent developments
11.1.2.3.1 Deals
11.1.2.3.2 Expansions
11.1.2.3.3 Other developments
11.1.2.4 MnM view
11.1.2.4.1 Right to win
11.1.2.4.2 Strategic choices
11.1.2.4.3 Weaknesses and competitive threats
11.1.3 SHELL PLC
11.1.3.1 Business overview
11.1.3.2 Products offered
11.1.3.3 Recent developments
11.1.3.3.1 Deals
11.1.3.4 MnM view
11.1.3.4.1 Right to win
11.1.3.4.2 Strategic choices
11.1.3.4.3 Weaknesses and competitive threats
11.1.4 EQUINOR ASA
11.1.4.1 Business overview
11.1.4.2 Products offered
11.1.4.3 Recent developments
11.1.4.3.1 Deals
11.1.4.3.2 Other developments
11.1.4.4 MnM view
11.1.4.4.1 Right to win
11.1.4.4.2 Strategic choices
11.1.4.4.3 Weaknesses and competitive threats
11.1.5 TOTALENERGIES SE
11.1.5.1 Business overview
11.1.5.2 Products offered
11.1.5.3 Recent developments
11.1.5.3.1 Deals
11.1.5.4 MnM view
11.1.5.4.1 Right to win
11.1.5.4.2 Strategic choices
11.1.5.4.3 Weaknesses and competitive threats
11.1.6 LINDE PLC
11.1.6.1 Business overview
11.1.6.2 Products offered
11.1.6.3 Recent developments
11.1.6.3.1 Deals
11.1.7 MITSUBISHI HEAVY INDUSTRIES, LTD.
11.1.7.1 Business overview
11.1.7.2 Products offered
11.1.7.3 Recent developments
11.1.7.3.1 Deals
11.1.7.3.2 Expansions
11.1.7.3.3 Other developments
11.1.8 JGC HOLDINGS CORPORATION
11.1.8.1 Business overview
11.1.8.2 Products offered
11.1.8.3 Recent developments
11.1.8.3.1 Deals
11.1.9 SCHLUMBERGER LIMITED
11.1.9.1 Business overview
11.1.9.2 Products offered
11.1.9.3 Recent developments
11.1.9.3.1 Deals
11.1.10 AKER SOLUTIONS
11.1.10.1 Business overview
11.1.10.2 Products offered
11.1.10.3 Recent developments
11.1.11 HONEYWELL INTERNATIONAL
11.1.11.1 Business overview
11.1.11.2 Products offered
11.1.11.3 Recent developments
11.1.11.3.1 Deals
11.1.12 HITACHI, LTD.
11.1.12.1 Business overview
11.1.12.2 Products offered
11.1.12.3 Recent developments
11.1.12.3.1 Deals
11.1.13 SIEMENS AG
11.1.13.1 Business overview
11.1.13.2 Products offered
11.1.14 GE VERNOVA
11.1.14.1 Business overview
11.1.14.2 Products offered
11.1.14.3 Recent developments
11.1.14.3.1 Deals
11.1.14.3.2 Other developments
11.1.15 HALLIBURTON
11.1.15.1 Business overview
11.1.15.2 Products offered
11.1.15.3 Recent developments
11.1.15.3.1 Deals
11.2 OTHER KEY MARKET PLAYERS
11.2.1 CLIMEWORKS AG
11.2.2 CARBON CLEAN SOLUTIONS
11.2.3 OCCIDENTAL
11.2.4 GREEN MINERALS
11.2.5 CARBICRETE
11.2.6 CARBONFREE
11.2.7 SVANTE TECHNOLOGIES INC.
11.2.8 GREEN POWER INTERNATIONAL PVT. LTD.
11.2.9 WOLF MIDSTREAM
11.2.10 BABCOCK & WILCOX
12 EMERGING TECHNOLOGIES
12.1 MICROBIAL ELECTROSYNTHESIS (MES)
12.1.1 INTRODUCTION
12.1.2 DETAILED DESCRIPTION
12.1.3 KEY COMPANIES/COUNTRIES/INSTITUTES RESEARCHING MES
12.1.3.1 List of companies/universities
12.1.3.2 Investment and funding scenario
12.1.3.2.1 LanzaTech
12.1.3.2.2 Electrochaea
12.1.4 MNM VIEW ON GROWTH POTENTIAL/FUTURE OUTLOOK
12.2 CO2 CAPTURE USING ADSORPTION TECHNIQUE (USING ZEOLITE AS ADSORBENT)
12.2.1 INTRODUCTION
12.2.2 DETAILED DESCRIPTION
12.2.2.1 Zeolite A for CO2 capture
12.2.2.1.1 Modification of zeolite A for improved CO2 capture