군용 커넥터 시장 예측(-2030년) : 형상별, 유형별, 플랫폼별, 판매 시점별, 지역별
Military Connectors Market by Shape {Circular [Mil-DTL-(38999,26482,5015)], Rectangular [MIL-DTL-(24308, 83513, 55302)]}, Type (Power, Signal, Data, RF & Microwave, Fiber Optic, Hybrid), Platform, Point of Sale and Region - Global Forecast to 2030
상품코드:1782040
리서치사:MarketsandMarkets
발행일:2025년 07월
페이지 정보:영문 276 Pages
라이선스 & 가격 (부가세 별도)
ㅁ Add-on 가능: 고객의 요청에 따라 일정한 범위 내에서 Customization이 가능합니다. 자세한 사항은 문의해 주시기 바랍니다.
한글목차
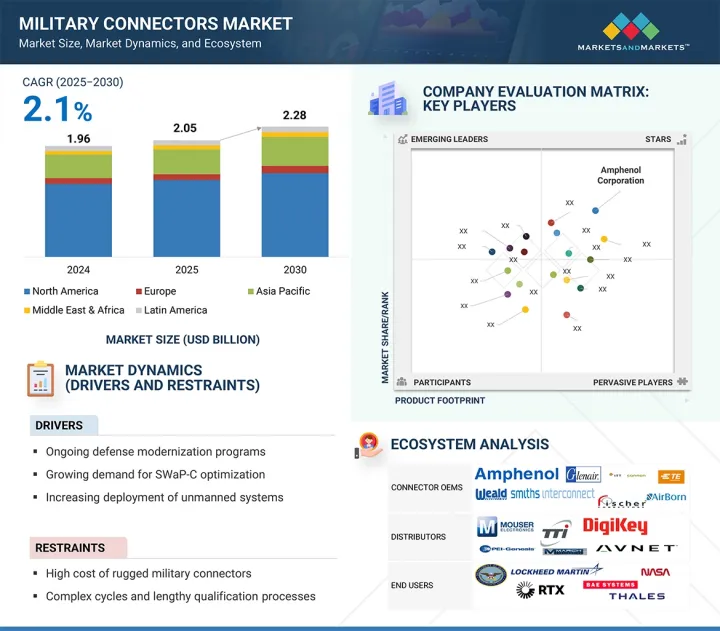
세계의 군용 커넥터 시장 규모는 2025년 20억 5,000만 달러에서 2030년까지 22억 8,000만 달러에 달할 것으로 예측되며, CAGR로 2.1%의 성장이 전망됩니다.
C4ISR, 전자전, 무인항공기 등 첨단 방어 시스템에 사용되는 강력하고 탄력적인 상호연결 솔루션이 시장을 주도하고 있습니다.
조사 범위
조사 대상연도
2021-2030년
기준연도
2024년
예측 기간
2025-2030년
단위
10억 달러
부문
형상, 유형, 플랫폼, 판매 시점, 지역
대상 지역
북미, 유럽, 아시아태평양, 기타 지역
군용 자산의 현대화, 열악한 환경에서의 안전한 데이터 전송 및 전력 전송에 대한 필요성이 증가하고 있는 것도 성장을 가속하고 있습니다. 국방비 증가와 자율 플랫폼에 대한 투자는 소형 고성능 커넥터에 대한 수요를 유발하고 있습니다.
"원형 부문은 예측 기간 중 군용 커넥터 시장에서 가장 큰 점유율을 차지할 것으로 예측됩니다. "
원형 부문은 육상, 항공, 해상 방위 차량에 널리 사용되므로 군용 커넥터 시장에서 가장 큰 점유율을 차지하고 있습니다. 원형 커넥터는 작고 내구성이 뛰어나며, 미션 크리티컬한 용도에서 쉽게 결합할 수 있다는 점에서 선택됩니다. 원형 커넥터는 통신, 항공전자, 레이더, 군인이 착용하는 장비 등의 전력, 신호, 데이터를 전송합니다. 충격, 진동, EMI 등 가혹한 환경에 대한 내구성이 뛰어나 국방용으로 적합합니다.
"우주 부문은 예측 기간 중 군용 커넥터 시장에서 가장 빠른 성장세를 보일 것으로 예측됩니다. "
우주 부문이 군용 커넥터 시장에서 급성장하고 있는 이유는 위성, 우주 감시 시스템, 국방 페이로드에서 소형 고성능 커넥터에 대한 요구가 증가하고 있기 때문입니다. 우주 작전을 위한 군용 커넥터는 극한의 온도, 진공 상태, 방사선을 견뎌야 하며, 지속적인 신호와 전력 공급을 보장해야 합니다. 이 커넥터는 군용 통신 위성, 조기 경보 시스템, 안전한 우주 기반 데이터 링크에 필수적인 역할을 하고 있습니다.
"유럽은 예측 기간 중 군용 커넥터 시장에서 가장 높은 CAGR을 나타낼 것으로 예측됩니다. "
유럽은 국방비 지출, 지역 안보 우려, 강력한 산업 기반 등으로 인해 군용 커넥터 시장에서 가장 빠르게 성장하고 있습니다. 각국은 지상, 해상, 항공 시스템 업그레이드에 많은 투자를 하고 있으며, 이러한 시스템에는 견고하고 고성능의 커넥터가 필요합니다. 현재와 미래의 국방 프로젝트는 모두 디지털 병사 시스템, 네트워크 통신, 자율 플랫폼에 초점을 맞추고 있으며, 신호 및 전력 상호 연결에 대한 안정적인 수요를 유지하고 있습니다.
세계의 군용 커넥터 시장에 대해 조사분석했으며, 주요 촉진요인과 억제요인, 경쟁 구도, 향후 동향 등의 정보를 제공하고 있습니다.
목차
제1장 서론
제2장 조사 방법
제3장 개요
제4장 중요한 인사이트
군용 커넥터 시장의 기업에 매력적인 기회
군 커넥터 시장 : 플랫폼별
군용 커넥터 시장 : 해상 플랫폼별
군 커넥터 시장 : 항공 플랫폼별
군용 커넥터 시장 : 판매 시점별
제5장 시장 개요
서론
시장 역학
촉진요인
억제요인
기회
과제
고객 비즈니스에 영향을 미치는 동향과 혼란
밸류체인 분석
가격 분석
주요 기업이 제공하는 군용 커넥터의 평균 판매 가격
평균 판매 가격 : 지역별
운영 데이터
에코시스템 분석
유명 기업
민간기업과 중소기업
최종사용자
규제 상황
규제기관, 정부기관, 기타 조직
주요 규제
무역 분석
수입 시나리오(HS 코드 853690)
수출 시나리오(HS 코드 853690)
주요 컨퍼런스와 이벤트(2025-2026년)
주요 이해관계자와 구입 기준
사례 연구 분석
비즈니스 모델
OEM 생산
커스텀 디자인 서비스
MRO 서비스
투자와 자금조달 시나리오
기술 분석
주요 기술
보완 기술
거시경제 전망
북미
유럽
아시아태평양
중동 및 아프리카
라틴아메리카
미국 관세(2025년)
서론
주요 관세율
가격의 영향 분석
국가/지역에 대한 영향
최종 용도 산업에 대한 영향
AI/생성형 AI의 영향
기술 동향
원형 하이브리드 커넥터
나노/피코 커넥터
내열성 재료
EMP 강화 커넥터
메가트렌드의 영향
디지털 트윈 시뮬레이션
커넥터 헬스 모니터링
디지털 스레드 통합
AI 주도 전장의 수요
테크놀러지 로드맵
특허 분석
제6장 군용 커넥터 시장 : 형상별
서론
원형
장방형
제7장 군용 커넥터 시장 : 유형별
서론
전원 커넥터
신호 커넥터
데이터 커넥터
RF·마이크로파 커넥터
광섬유 커넥터
하이브리드 커넥터
제8장 군용 커넥터 시장 : 플랫폼별
서론
육상
항공
해상
우주
제9장 군용 커넥터 시장 : 판매 시점별
서론
OEM
애프터마켓
제10장 군용 커넥터 시장 : 지역별
서론
북미
PESTLE 분석
미국
캐나다
유럽
PESTLE 분석
영국
독일
프랑스
이탈리아
기타 유럽
아시아태평양
PESTLE 분석
일본
인도
한국
호주
기타 아시아태평양
중동 및 아프리카
PESTLE 분석
GCC
이스라엘
튀르키예
남아프리카공화국
라틴아메리카
PESTLE 분석
브라질
기타 라틴아메리카
제11장 경쟁 구도
서론
주요 참여 기업의 전략/강점(2020-2024년)
매출 분석(2021-2024년)
시장 점유율 분석(2024년)
브랜드/제품 비교
기업의 평가와 재무 지표
기업 평가 매트릭스 : 주요 기업(2024년)
기업 평가 매트릭스 : 스타트업/중소기업(2024년)
경쟁 시나리오
제12장 기업 개요
주요 기업
AMPHENOL CORPORATION
TE CONNECTIVITY
ITT INC.
GLENAIR, INC.
FISCHER CONNECTORS SA
EATON
SMITHS GROUP PLC
NICOMATIC
WINCHESTER INTERCONNECT
MILNEC INTERCONNECT SYSTEMS
WEALD ELECTRONICS LTD
OMNETICS CONNECTOR CORP
TURCK, INC
CONESYS
RAY SERVICE, A.S.
ROJONE PTY LTD
ALLIED ELECTRONICS CORPORATION
기타 기업
HIREL CONNECTORS INC.
AIRBORN LLC
SAMTEC
SUNKYE INTERNATIONAL CO., LTD.
LEMO
HARWIN
ODU GMBH & CO. KG
MIL-CON, INC.
CRISTEK INTERCONNECTS, LLC
CONNECTIVE DESIGN, INC.
제13장 부록
KSA
영문 목차
영문목차
The military connectors market is expected to reach USD 2.28 billion by 2030, from USD 2.05 billion in 2025, at a CAGR of 2.1%. The market is led by strong and resilient interconnect solutions used in cutting-edge defense systems, including C4ISR, electronic warfare, and unmanned aerial vehicles.
Scope of the Report
Years Considered for the Study
2021-2030
Base Year
2024
Forecast Period
2025-2030
Units Considered
Value (USD Billion)
Segments
By Shape, Type, Platform, and Point of Sale and Region
Regions covered
North America, Europe, APAC, RoW
Increasing military asset modernization and the need for secure data and power transmission in extreme environments are also propelling growth. Increasing defense spending and investment in autonomous platforms are compelling demand for miniature, high-performance connectors.
"The circular segment is expected to account for the largest share in the military connectors market during the forecast period."
The circular segment accounts for the largest share of the military connectors market because it is widely used on ground, air, and naval defense vehicles. Circular connectors are chosen for their small size, durability, and easy coupling in mission-critical applications. They transmit power, signals, and data for communications, avionics, radar, and soldier-wearable devices. Their durability against harsh environments like shock, vibration, and EMI makes them perfect for defense applications.
"The space segment is expected to exhibit the fastest growth in the military connectors market during the forecast period."
The space segment is rapidly growing in the military connectors market because the need for small, high-performance connectors in satellites, space-based surveillance systems, and defense payloads is rising. Military connectors for space missions must withstand extreme temperatures, vacuum conditions, and radiation, while ensuring continuous signal and power supply. These connectors have become essential to military communications satellites, early warning systems, and secure space-based data links.
"Europe is expected to record the highest CAGR in the military connectors market during the forecast period."
Europe is the fastest-growing market for military connectors due to defense spending, regional security concerns, and strong industrial bases. Countries are heavily investing in upgrading ground, water, and air systems, which require rugged, high-performance connectors. Both current and upcoming defense projects focus on digital soldier systems, networking communications, and autonomous platforms, which maintain steady demand for signal and power interconnects.
Breakdown of primaries
The study includes insights from various industry experts, from component suppliers to Tier-1 companies and OEMs. The breakdown of the primary sources is as follows:
By Company Type: Tier 1-45%; Tier 2-35%; Tier 3-20%
By Designation: C-level-50%; D-level-25%; Others-25%
By Region: North America-40%; Europe-25%; Asia Pacific-15%; Middle East & Africa-10%; Latin America-10%
Amphenol Corporation (US), TE Connectivity (Ireland), ITT Inc. (US), Glenair, Inc (US), Fischer Connectors SA (Switzerland), Eaton (Ireland), and Smiths Group Plc (US) are some of the leading players in the military connectors market.
Research coverage
The study covers the military connectors market across various segments and subsegments. It aims to estimate the size and growth potential of this market across different segments based on shape, type, platform, point of sale, and region. This study also includes an in-depth competitive analysis of the key players in the market, along with their company profiles, key observations related to their solutions and business offerings, recent developments undertaken by them, and key market strategies adopted them.
Key benefits of buying this report:
This report will help market leaders/new entrants with information on the closest approximations of the revenue numbers for the overall military connectors market and its subsegments. The report covers the entire ecosystem of the military connectors market. It will help stakeholders understand the competitive landscape and gain more insights to better position their businesses and plan suitable go-to-market strategies. The report will also help stakeholders understand the pulse of the market and provide them with information on key market drivers, restraints, challenges, and opportunities.
The report provides insights into the following pointers:
Analysis of key drivers such as high demand for water quality monitoring and ocean data mapping, surging asymmetric threats, the need for maritime security, and increasing capital expenditure in offshore oil and gas industries in the military connectors market
Product Development: In-depth analysis of product innovation/development by companies across various regions
Market Development: Comprehensive information about lucrative markets - the report analyses the military connectors market across varied regions
Market Diversification: Exhaustive information about new solutions, untapped geographies, recent developments, and investments in the military connectors market
Competitive Assessment: In-depth assessment of market shares, growth strategies, and product offerings of leading players like Amphenol Corporation (US), ITT Inc. (US), Glenair, Inc (US), and Fischer Connectors SA (Switzerland), among others in the military connectors market
TABLE OF CONTENTS
1 INTRODUCTION
1.1 STUDY OBJECTIVES
1.2 MARKET DEFINITION
1.3 STUDY SCOPE
1.3.1 MARKETS COVERED AND REGIONAL SCOPE
1.3.2 INCLUSIONS AND EXCLUSIONS
1.3.3 YEARS CONSIDERED
1.4 CURRENCY CONSIDERED
1.5 STAKEHOLDERS
2 RESEARCH METHODOLOGY
2.1 RESEARCH DATA
2.1.1 SECONDARY DATA
2.1.1.1 Key data from secondary sources
2.1.2 PRIMARY DATA
2.1.2.1 Primary interview participants
2.1.2.2 Key data from primary sources
2.1.2.3 Breakdown of primary interviews
2.1.2.4 Insights from industry experts
2.2 FACTOR ANALYSIS
2.2.1 DEMAND-SIDE INDICATORS
2.2.2 SUPPLY-SIDE INDICATORS
2.3 MARKET SIZE ESTIMATION
2.3.1 BOTTOM-UP APPROACH
2.3.1.1 Market size estimation methodology
2.3.2 TOP-DOWN APPROACH
2.4 DATA TRIANGULATION
2.5 RESEARCH ASSUMPTIONS
2.6 RESEARCH LIMITATIONS
2.7 RISK ASSESSMENT
3 EXECUTIVE SUMMARY
4 PREMIUM INSIGHTS
4.1 ATTRACTIVE OPPORTUNITIES FOR PLAYERS IN MILITARY CONNECTORS MARKET
4.2 MILITARY CONNECTORS MARKET, BY PLATFORM
4.3 MILITARY CONNECTORS MARKET, BY NAVAL PLATFORM
4.4 MILITARY CONNECTORS MARKET, BY AIRBORNE PLATFORM
4.5 MILITARY CONNECTORS MARKET, BY POINT OF SALE
5 MARKET OVERVIEW
5.1 INTRODUCTION
5.2 MARKET DYNAMICS
5.2.1 DRIVERS
5.2.1.1 Modernization of defense electronics
5.2.1.2 Elevated demand for SWaP-C optimization
5.2.1.3 Rapid deployment of unmanned systems
5.2.2 RESTRAINTS
5.2.2.1 High cost of ruggedized military connectors
5.2.2.2 Complex and lengthy qualification process
5.2.2.3 Supply chain disruptions and material dependencies
5.2.3 OPPORTUNITIES
5.2.3.1 Digitization of military platforms and shift toward network-centric warfare
5.2.3.2 Increased defense budgets in Asia Pacific and Middle East
5.2.3.3 Retrofit and upgrade programs for legacy platforms
5.2.4 CHALLENGES
5.2.4.1 Risk of counterfeit components
5.2.4.2 Stringent export control regulations
5.2.4.3 Adherence to harsh operating environment requirements
5.3 TRENDS AND DISRUPTIONS IMPACTING CUSTOMER BUSINESS
5.4 VALUE CHAIN ANALYSIS
5.5 PRICING ANALYSIS
5.5.1 AVERAGE SELLING PRICE OF MILITARY CONNECTORS OFFERED BY KEY PLAYERS
5.5.2 AVERAGE SELLING PRICE, BY REGION
5.6 OPERATIONAL DATA
5.7 ECOSYSTEM ANALYSIS
5.7.1 PROMINENT COMPANIES
5.7.2 PRIVATE AND SMALL ENTERPRISES
5.7.3 END USERS
5.8 REGULATORY LANDSCAPE
5.8.1 REGULATORY BODIES, GOVERNMENT AGENCIES, AND OTHER ORGANIZATIONS
5.8.2 KEY REGULATIONS
5.8.2.1 North America
5.8.2.2 Europe
5.8.2.3 Asia Pacific
5.8.2.4 Middle East & Africa
5.8.2.5 Latin America
5.9 TRADE ANALYSIS
5.9.1 IMPORT SCENARIO (HS CODE 853690)
5.9.2 EXPORT SCENARIO (HS CODE 853690)
5.10 KEY CONFERENCES AND EVENTS, 2025-2026
5.11 KEY STAKEHOLDERS AND BUYING CRITERIA
5.11.1 KEY STAKEHOLDERS IN BUYING PROCESS
5.11.2 BUYING CRITERIA
5.12 CASE STUDY ANALYSIS
5.12.1 AMPHENOL'S MIL-DTL-38999 SERIES III CIRCULAR CONNECTORS
5.12.2 TE'S MULTIGIG RT 2-R AND ARINC 836A CONNECTOR SOLUTIONS
5.12.3 HUBER+SUHNER'S QMA WATERPROOF RF CONNECTORS AND SENCITY SHIELDED CABLING SYSTEM
5.13 BUSINESS MODELS
5.13.1 OEM PRODUCTION
5.13.2 CUSTOM DESIGN SERVICES
5.13.3 MRO SERVICES
5.14 INVESTMENT AND FUNDING SCENARIO
5.15 TECHNOLOGY ANALYSIS
5.15.1 KEY TECHNOLOGIES
5.15.1.1 Shielding
5.15.1.2 Ruggedized cable assemblies
5.15.1.3 Contact plating
5.15.2 COMPLEMENTARY TECHNOLOGIES
5.15.2.1 High-speed data transmission
5.15.2.2 Miniaturization
5.15.2.3 Fiber optic connectors
5.16 MACROECONOMIC OUTLOOK
5.16.1 NORTH AMERICA
5.16.2 EUROPE
5.16.3 ASIA PACIFIC
5.16.4 MIDDLE EAST & AFRICA
5.16.5 LATIN AMERICA
5.17 2025 US TARIFF
5.17.1 INTRODUCTION
5.17.2 KEY TARIFF RATES
5.17.3 PRICE IMPACT ANALYSIS
5.17.4 IMPACT ON COUNTRY/REGION
5.17.4.1 US
5.17.4.2 EU
5.17.4.3 Asia Pacific
5.17.5 IMPACT ON END-USE INDUSTRIES
5.17.5.1 Army
5.17.5.2 Navy
5.17.5.3 Airforce
5.18 IMPACT OF AI/GEN AI
5.19 TECHNOLOGY TRENDS
5.19.1 CIRCULAR HYBRID CONNECTORS
5.19.2 NANO AND PICO CONNECTORS
5.19.3 HIGH-TEMPERATURE TOLERANT MATERIALS
5.19.4 EMP-HARDENED CONNECTORS
5.20 IMPACT OF MEGATRENDS
5.20.1 DIGITAL TWIN SIMULATION
5.20.2 CONNECTOR HEALTH MONITORING
5.20.3 DIGITAL THREAD INTEGRATION
5.20.4 AI-DRIVEN BATTLEFIELD DEMANDS
5.21 TECHNOLOGY ROADMAP
5.22 PATENT ANALYSIS
6 MILITARY CONNECTORS MARKET, BY SHAPE
6.1 INTRODUCTION
6.2 CIRCULAR
6.2.1 LARGE-SCALE ADOPTION BY GLOBAL DEFENSE SECTOR
6.2.2 MIL-DTL-38999
6.2.3 MIL-DTL-26482
6.2.4 MIL-DTL-5015
6.2.5 OTHERS
6.3 RECTANGULAR
6.3.1 SHIFT TOWARD DIGITAL AND ELECTRONIC WARFARE CAPABILITIES
6.3.2 MIL-DTL-24308
6.3.3 MIL-DTL-83513
6.3.4 MIL-DTL-55302
6.3.5 OTHERS
7 MILITARY CONNECTORS MARKET, BY TYPE
7.1 INTRODUCTION
7.2 POWER CONNECTORS
7.2.1 ABILITY TO WITHSTAND HARSH MILITARY ENVIRONMENTS
7.3 SIGNAL CONNECTORS
7.3.1 EXTENSIVE USE IN AVIONICS AND VEHICLE CONTROL UNITS
7.4 DATA CONNECTORS
7.4.1 ONGOING DIGITALIZATION IN DEFENSE PLATFORMS
7.5 RF & MICROWAVE CONNECTORS
7.5.1 NEED FOR HIGH-FREQUENCY SIGNAL TRANSMISSION ACROSS MILITARY APPLICATIONS
7.6 FIBER OPTIC CONNECTORS
7.6.1 RAPID DEPLOYMENT IN NETWORK-CENTRIC WARFARE AND SENSOR SYSTEMS
7.7 HYBRID CONNECTORS
7.7.1 FOCUS ON ENHANCING MODULARITY IN MILITARY PLATFORMS
8 MILITARY CONNECTORS MARKET, BY PLATFORM
8.1 INTRODUCTION
8.2 LAND
8.2.1 TREND OF MODULAR VEHICLE ARCHITECTURES AND DIGITAL BATTLEFIELD INTEGRATION
8.2.2 COMMAND CENTERS
8.2.3 SOLDIER SYSTEMS
8.2.4 ARMORED VEHICLES
8.2.4.1 Combat vehicles
8.2.4.2 Combat support vehicles
8.2.4.3 Unmanned ground vehicles
8.3 AIRBORNE
8.3.1 NEED FOR HIGH-SPEED DATA TRANSMISSION ACROSS MISSION-CRITICAL APPLICATIONS
8.3.2 MILITARY AIRCRAFT
8.3.3 HELICOPTERS
8.3.4 UNMANNED AERIAL VEHICLES
8.4 NAVAL
8.4.1 RAPID INTEGRATION OF MODULAR COMBAT SYSTEMS AND ADVANCED SENSORS
8.4.2 SHIPS
8.4.2.1 Aircraft carriers
8.4.2.2 Amphibious
8.4.2.3 Destroyers
8.4.2.4 Frigates
8.4.2.5 Corvettes
8.4.2.6 Patrol vehicles
8.4.3 SUBMARINES
8.4.4 UNMANNED MARINE VEHICLES
8.5 SPACE
8.5.1 SHIFT IN DEFENSE PRIORITIES FOR RESPONSIVE LAUNCH CAPABILITIES
8.5.2 SATELLITE
9 MILITARY CONNECTORS MARKET, BY POINT OF SALE
9.1 INTRODUCTION
9.2 OEM
9.2.1 RISING CONNECTOR DEMAND AMID NEW SYSTEM PRODUCTION AND INTEGRATION
9.3 AFTERMARKET
9.3.1 STRATEGIC FOCUS ON EXTENDING LIFE OF LEGACY PLATFORMS
10 MILITARY CONNECTORS MARKET, BY REGION
10.1 INTRODUCTION
10.2 NORTH AMERICA
10.2.1 PESTLE ANALYSIS
10.2.2 US
10.2.2.1 Defense modernization programs to drive market
10.2.3 CANADA
10.2.3.1 Arctic defense expansion and NORAD modernization to drive market
10.3 EUROPE
10.3.1 PESTLE ANALYSIS
10.3.2 UK
10.3.2.1 Tempest program advancements and NATO interoperability upgrades to drive market
10.3.3 GERMANY
10.3.3.1 Eurofighter upgrade programs and green defense push to drive market
10.3.4 FRANCE
10.3.4.1 Rafale fleet expansion and strategic push for autonomy to drive market
10.3.5 ITALY
10.3.5.1 Naval feet modernization and Eurofighter upgrades to drive market
10.3.6 REST OF EUROPE
10.4 ASIA PACIFIC
10.4.1 PESTLE ANALYSIS
10.4.2 JAPAN
10.4.2.1 F-X fighter development and domestic industrial policy to drive market
10.4.3 INDIA
10.4.3.1 Indigenous fighter programs, border defense expansion, and Make-in-India push to drive market
10.4.4 SOUTH KOREA
10.4.4.1 Indigenous defense system development and export-focused production strategy to drive market
10.4.5 AUSTRALIA
10.4.5.1 Defense force modernization and AUKUS technology alignment to drive market
10.4.6 REST OF ASIA PACIFIC
10.5 MIDDLE EAST & AFRICA
10.5.1 PESTLE ANALYSIS
10.5.2 GCC
10.5.2.1 Saudi Arabia
10.5.2.1.1 Vision 2030 and defense self-reliance goals to drive market
10.5.2.2 UAE
10.5.2.2.1 Autonomous system adoption and naval ISR expansion to drive market
10.5.3 ISRAEL
10.5.3.1 Emphasis on multi-domain network-centric warfare to drive market
10.5.4 TURKEY
10.5.4.1 Rise in drone swarm integration and air defense autonomy to drive market
10.5.5 SOUTH AFRICA
10.5.5.1 Focus on modernizing border security systems to drive market
10.6 LATIN AMERICA
10.6.1 PESTLE ANALYSIS
10.6.2 BRAZIL
10.6.2.1 International defense industrial partnerships to drive market
10.6.3 REST OF LATIN AMERICA
11 COMPETITIVE LANDSCAPE
11.1 INTRODUCTION
11.2 KEY PLAYER STRATEGIES/RIGHT TO WIN, 2020-2024
11.3 REVENUE ANALYSIS, 2021-2024
11.4 MARKET SHARE ANALYSIS, 2024
11.5 BRAND/PRODUCT COMPARISON
11.6 COMPANY VALUATION AND FINANCIAL METRICS
11.7 COMPANY EVALUATION MATRIX: KEY PLAYERS, 2024
11.7.1 STARS
11.7.2 EMERGING LEADERS
11.7.3 PERVASIVE PLAYERS
11.7.4 PARTICIPANTS
11.7.5 COMPANY FOOTPRINT
11.7.5.1 Company footprint
11.7.5.2 Region footprint
11.7.5.3 Platform footprint
11.7.5.4 Type footprint
11.8 COMPANY EVALUATION MATRIX: START-UPS/SMES, 2024
11.8.1 PROGRESSIVE COMPANIES
11.8.2 RESPONSIVE COMPANIES
11.8.3 DYNAMIC COMPANIES
11.8.4 STARTING BLOCKS
11.8.5 COMPETITIVE BENCHMARKING
11.8.5.1 List of start-ups/SMEs
11.8.5.2 Competitive benchmarking of start-ups/SMEs