Electronic Ceramics Market Opportunity, Growth Drivers, Industry Trend Analysis, and Forecast 2026 - 2035
상품코드:1928884
리서치사:Global Market Insights Inc.
발행일:2026년 01월
페이지 정보:영문 210 Pages
라이선스 & 가격 (부가세 별도)
ㅁ Add-on 가능: 고객의 요청에 따라 일정한 범위 내에서 Customization이 가능합니다. 자세한 사항은 문의해 주시기 바랍니다.
한글목차
세계의 전자 세라믹 시장은 2025년에 281억 달러로 평가되었으며, 2035년까지 CAGR 6.1%로 성장하여 522억 달러에 달할 것으로 예측됩니다.
시장 성장은 첨단 전자제품의 지속적인 확대, 고속 연결성, 전동화 모빌리티, 전력 인프라의 업그레이드로 뒷받침되고 있습니다. 커넥티드 디바이스의 대규모 생산은 신호 무결성, 에너지 효율성, 열 안정성을 제공하는 세라믹 기반 부품에 대한 지속적인 수요를 견인하고 있습니다. 무선 통신 및 차세대 네트워크의 발전으로 인해 고주파 및 마이크로파 응용 분야에 대한 세라믹 재료의 성능 요구 사항이 증가하고 있습니다. 자동차 분야에서는 전기 구동 시스템, 파워 일렉트로닉스, 충전 시스템이 고전압 및 고온 환경에서 작동할 수 있는 세라믹 기판 및 절연체를 필요로 하기 때문에 장기적인 수요가 강화되고 있습니다. 산업용 전력 시스템, 송전망 현대화, 자동화 솔루션에서도 절연, 에너지 저장, 제어 시스템에 세라믹 소재가 채택되어 시장 확대에 기여하고 있습니다. 아시아태평양은 전자기기 제조가 집중되어 있어 세계 시장 가치의 약 60%를 차지하고 있습니다. 반면, 북미와 유럽에서는 고신뢰성 및 특수 용도의 고가 제품에 중점을 두고 있습니다. 지속적인 소형화, 진화하는 메모리 기술, 자동차의 전동화, 규제 중심의 재료 혁신으로 인해 응용 분야의 기회는 계속 확대되고 있습니다.
시장 범위
시작 연도
2025년
예측 연도
2026-2035
개시시 가치
281억 달러
예측 금액
522억 달러
CAGR
6.1%
제품 카테고리별로는 유전체 세라믹이 2025년 40%의 점유율을 차지했습니다. 이는 적층 세라믹 커패시터, 공진기, 고주파 부품에 대한 강한 수요에 힘입은 것입니다. 자성 세라믹 재료는 유도 부품, 전자기 간섭 방지, 첨단 통신 시스템에 사용되어 시장의 약 15%를 차지했습니다.
소비자 전자제품 및 가전제품은 주요 최종 사용 분야로, 커넥티드 디바이스, 스마트 시스템, 디지털 가전제품에 광범위하게 사용되는 세라믹 부품을 대량으로 소비하고 있습니다. 지능형, 고연결성, 고성능 소비재의 보급 확대는 신호 처리, 에너지 저장, 열 관리를 지원하는 소형의 신뢰할 수 있는 세라믹 소재에 대한 수요를 지속적으로 자극하고 있습니다.
미국 전자 세라믹 시장은 2025년 61억 달러에 달할 것으로 예상되며, 리쇼어링 정책, 반도체 및 첨단 제조에 대한 우대 조치, 전기자동차 생산 확대 등을 배경으로 2035년까지 120억 달러에 육박할 것으로 전망됩니다. 이 지역에서는 항공우주, 의료기술, 국방, 첨단 전력전자 분야의 고신뢰성 용도가 강조되고 있으며, 평균 판매 가격 상승과 공급망 보안에 대한 투자 확대에 기여하고 있습니다.
목차
제1장 조사 방법과 범위
제2장 주요 요약
제3장 업계 인사이트
생태계 분석
공급업체 상황
이익률
각 단계의 부가가치
밸류체인에 영향을 미치는 요인
디스럽션
업계에 대한 영향요인
성장 촉진요인
업계의 잠재적 리스크와 과제
시장 기회
성장 가능성 분석
규제 상황
북미
유럽
아시아태평양
라틴아메리카
중동 및 아프리카
Porters 분석
PESTEL 분석
가격 동향
지역별
제품 유형별
향후 시장 동향
기술과 혁신 동향
현재 기술 동향
신기술
특허 상황
무역 통계(HS 코드)(참고 : 무역 통계는 주요국에 대해서만 제공됩니다)
주요 수입국
주요 수출국
지속가능성과 환경면
지속가능한 대처
폐기물 절감 전략
생산의 에너지 효율
친환경적인 대처
탄소발자국에 관한 고려사항
제4장 경쟁 구도
소개
기업의 시장 점유율 분석
지역별
북미
유럽
아시아태평양
라틴아메리카
중동 및 아프리카
기업 매트릭스 분석
주요 시장 기업 경쟁 분석
경쟁 포지셔닝 매트릭스
주요 발전
인수합병
제휴·협업
신제품 발매
확대 계획
제5장 전자 세라믹 시장 : 제품 유형별, 2022-2035
강유전체 세라믹
압전 세라믹
초전성 세라믹
유전체 세라믹
자성 세라믹
절연·기판용 세라믹
전도성·전극용 세라믹
기타
제6장 전자 세라믹 시장 : 형상별, 2022-2035
벌크 세라믹
박막
분말
나노입자
복합재료
제7장 전자 세라믹 시장 : 최종 이용 산업별, 2022-2035
가전제품·소비자 전자제품
헬스케어
자동차·운송 장비
통신·송전
항공우주 및 방위
산업 자동화·파워 일렉트로닉스
에너지·발전
IoT 및 웨어러블 기기
기타
제8장 시장 규모 및 예측 : 지역별, 2022-2035
북미
미국
캐나다
유럽
영국
독일
프랑스
이탈리아
스페인
기타 유럽
아시아태평양
중국
인도
일본
한국
호주
기타 아시아태평양
라틴아메리카
브라질
멕시코
아르헨티나
기타 라틴아메리카
중동 및 아프리카
남아프리카공화국
사우디아라비아
아랍에미리트
기타 중동 및 아프리카
제9장 기업 개요
APC International
CeramTec Holding
Central Electronics
Kyocera Corporation
Maruwa
Morgan Advanced Materials
Murata Manufacturing
PI Ceramics
Sensor Technology
Sparkler Ceramics
KSM
영문 목차
영문목차
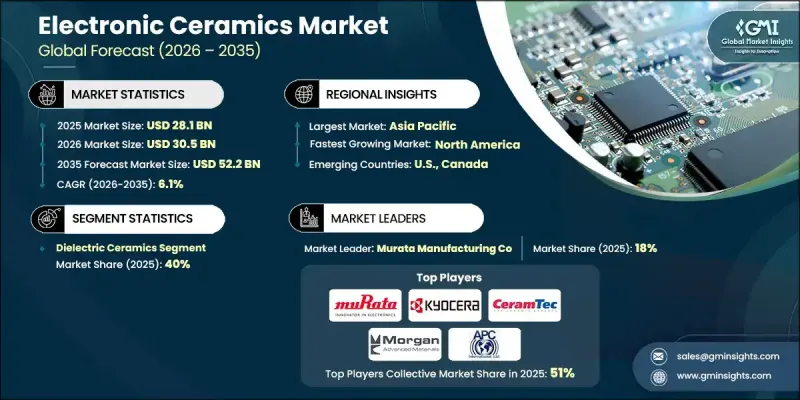
The Global Electronic Ceramics Market was valued at USD 28.1 billion in 2025 and is estimated to grow at a CAGR of 6.1% to reach USD 52.2 billion by 2035.
Market growth is supported by the continued expansion of advanced electronics, high-speed connectivity, electrified mobility, and power infrastructure upgrades. Large-scale production of connected devices drives sustained demand for ceramic-based components that enable signal integrity, energy efficiency, and thermal stability. Advancements in wireless communication and next-generation networks are increasing performance requirements for ceramic materials used in high-frequency and microwave applications. The automotive sector is reinforcing long-term demand as electric drivetrains, power electronics, and charging systems rely on ceramic substrates and insulators capable of operating at higher voltages and temperatures. Industrial power systems, grid modernization, and automation solutions further contribute to market expansion using ceramic materials for insulation, energy storage, and control systems. Asia Pacific represents nearly 60% of global market value due to its concentration of electronics manufacturing, while North America and Europe remain focused on high-reliability and specialty applications with premium pricing. Ongoing miniaturization, evolving memory technologies, automotive electrification, and regulatory-driven material innovation continue to widen application opportunities.
Market Scope
Start Year
2025
Forecast Year
2026-2035
Start Value
$28.1 Billion
Forecast Value
$52.2 Billion
CAGR
6.1%
By product category, the dielectric ceramics accounted for 40% share in 2025, supported by strong demand for multilayer ceramic capacitors, resonators, and radio-frequency components. Magnetic ceramic materials held close to 15% of the market, driven by their use in inductive components, electromagnetic interference control, and advanced communication systems.
The consumer electronics and home appliances represented the leading end-use segment, consuming high volumes of ceramic components used across connected devices, smart systems, and digital appliances. Growing adoption of intelligent, connected, and high-performance consumer products continues to stimulate demand for compact, reliable ceramic materials that support signal processing, energy storage, and heat management.
U.S. Electronic Ceramics Market reached USD 6.1 billion in 2025 and is expected to approach USD 12 billion by 2035, supported by reshoring initiatives, incentives for semiconductor and advanced manufacturing, and growth in electric vehicle production. The region emphasizes high-reliability applications across aerospace, medical technology, defense, and advanced power electronics, contributing to higher average selling prices and increased investment in supply chain security.
Key companies active in the Global Electronic Ceramics Market include Murata Manufacturing, Kyocera Corporation, CeramTec Holding, Morgan Advanced Materials, Maruwa, APC International, PI Ceramics, Sparkler Ceramics, Central Electronics, and Sensor Technology. Companies in the Global Electronic Ceramics Market are strengthening their market position by investing in advanced material research to improve dielectric performance, thermal conductivity, and reliability. Many players are expanding production capacity and regional manufacturing footprints to support supply chain resilience and meet local sourcing requirements. Strategic collaborations with electronics, automotive, and energy system manufacturers enable early integration into next-generation designs.
Table of Contents
Chapter 1 Methodology & Scope
1.1 Market scope and definition
1.2 Research design
1.2.1 Research approach
1.2.2 Data collection methods
1.3 Data mining sources
1.3.1 Global
1.3.2 Regional/Country
1.4 Base estimates and calculations
1.4.1 Base year calculation
1.4.2 Key trends for market estimation
1.5 Primary research and validation
1.5.1 Primary sources
1.6 Forecast model
1.7 Research assumptions and limitations
Chapter 2 Executive Summary
2.1 Industry 360° synopsis
2.2 Key market trends
2.2.1 Product type
2.2.2 Form factor
2.2.3 End use industry
2.3 TAM analysis, 2025-2034
2.4 CXO perspectives: Strategic imperatives
2.4.1 Executive decision points
2.4.2 Critical success factors
2.5 Outlook and strategic recommendations
Chapter 3 Industry Insights
3.1 Industry ecosystem analysis
3.1.1 Supplier landscape
3.1.2 Profit margin
3.1.3 Value addition at each stage
3.1.4 Factor affecting the value chain
3.1.5 Disruptions
3.2 Industry impact forces
3.2.1 Growth drivers
3.2.2 Industry pitfalls and challenges
3.2.3 Market opportunities
3.3 Growth potential analysis
3.4 Regulatory landscape
3.4.1 North America
3.4.2 Europe
3.4.3 Asia Pacific
3.4.4 Latin America
3.4.5 Middle East & Africa
3.5 Porter';s analysis
3.6 PESTEL analysis
3.7 Price trends
3.7.1 By region
3.7.2 By product type
3.8 Future market trends
3.9 Technology and innovation landscape
3.9.1 Current technological trends
3.9.2 Emerging technologies
3.10 Patent landscape
3.11 Trade statistics (HS code) (Note: the trade statistics will be provided for key countries only)
3.11.1 Major importing countries
3.11.2 Major exporting countries
3.12 Sustainability and environmental aspects
3.12.1 Sustainable practices
3.12.2 Waste reduction strategies
3.12.3 Energy efficiency in production
3.12.4 Eco-friendly initiatives
3.13 Carbon footprint considerations
Chapter 4 Competitive Landscape, 2024
4.1 Introduction
4.2 Company market share analysis
4.2.1 By region
4.2.1.1 North America
4.2.1.2 Europe
4.2.1.3 Asia Pacific
4.2.1.4 Latin America
4.2.1.5 Middle East & Africa
4.3 Company matrix analysis
4.4 Competitive analysis of major market players
4.5 Competitive positioning matrix
4.6 Key developments
4.6.1 Mergers & acquisitions
4.6.2 Partnerships & collaborations
4.6.3 New product launches
4.6.4 Expansion plans
Chapter 5 Electronic Ceramics Market, By Product Type, 2022-2035 (USD Billion, Kilo Tons)
5.1 Key trends
5.2 Ferroelectric ceramics
5.3 Piezoelectric ceramics
5.4 Pyroelectric ceramics
5.5 Dielectric ceramics
5.6 Magnetic ceramics
5.7 Insulating & substrate ceramics
5.8 Conductive & electrode ceramics
5.9 Others
Chapter 6 Electronic Ceramics Market, By Form Factor, 2022-2035 (USD Billion, Kilo Tons)
6.1 Key trends
6.2 Bulk ceramics
6.3 Thin films
6.4 Powders
6.5 Nanoparticles
6.6 Composite materials
Chapter 7 Electronic Ceramics Market, By End Use Industry, 2022-2035 (USD Billion, Kilo Tons)
7.1 Key trends
7.2 Home appliances & consumer electronics
7.3 Healthcare
7.4 Automotive & transportation
7.5 Telecommunication & power transmission
7.6 Aerospace & defense
7.7 Industrial automation & power electronics
7.8 Energy & power generation
7.9 IoT & wearables
7.10 Others
Chapter 8 Market Size and Forecast, By Region, 2022-2035 (USD Billion, Kilo Tons)