Resistant Starch Market Opportunity, Growth Drivers, Industry Trend Analysis, and Forecast 2026 - 2035
상품코드:1913458
리서치사:Global Market Insights Inc.
발행일:2026년 01월
페이지 정보:영문 190 Pages
라이선스 & 가격 (부가세 별도)
ㅁ Add-on 가능: 고객의 요청에 따라 일정한 범위 내에서 Customization이 가능합니다. 자세한 사항은 문의해 주시기 바랍니다.
한글목차
세계의 저항성 전분 시장은 2025년 125억 달러로 평가되었으며, 2035년까지 연평균 복합 성장률(CAGR) 6%로 성장하여 224억 달러에 이를 것으로 예측됩니다.
시장 성장은 대사성 질환 증가율에 강하게 영향을 받고 있으며, 식품 제조업체는 영양 프로파일을 개선한 배합 설계의 재검토를 강요받고 있습니다. 저항성 전분은 일상 식품의 익숙한 맛과 식감을 유지하면서, 식이섬유 함유량의 향상과 혈당에 대한 영향 저감을 가능하게 하는 점에서 주목을 끌고 있습니다. 소화기의 건강 유지, 포만감의 지속, 혈당의 안정화 등 기능적 이점에 의해 다양한 식품 카테고리에서의 사용이 확대되고 있습니다. 2021년부터 2025년까지, 원료의 이용가능성과 가공효율의 향상에 의해 특히 널리 재배되고 있는 작물로부터 대규모 생산이 지원되었습니다. 동시에 생산자는 지속가능성 목표와 클린 라벨 전략을 따르기 위해 대체 원료 공급원의 개척을 진행했습니다. 기능적 적합성에 기초하여, 다양한 유형의 저항성 전분이 주목을 받고, 화학적으로 변형된 선택과 비교하여 천연 유래 및 재결정형 변종이 시장에서 더 강하게 받아들여졌습니다. 이러한 복합 동향은 세계 식품 및 영양 시장에서 광범위한 채택을 계속 지원하고 있습니다.
시장 범위
시작 연도
2025년
예측 연도
2026-2035년
시작 규모
125억 달러
예측 금액
224억 달러
CAGR
6%
곡물 부문은 2025년 54%의 점유율을 차지했고, 2035년까지 연평균 복합 성장률(CAGR) 5.1%를 보일 것으로 예측됩니다. 수요는 특히 아시아태평양 시장에서 익숙한 작물 원료에 대한 선호와 지역 가용성에 의해 견인되고 있습니다. 곡물과 채소 유래의 저항성 전분도 깨끗한 라벨, 비유전자 재조합, 기능성 식품 용도에 대한 적성으로부터 주목을 받고 있습니다.
베이커리 제품 부문은 2025년 38%의 점유율을 차지했으며, 2035년까지 연평균 복합 성장률(CAGR) 6%를 보일 것으로 예측됩니다. 저항성 전분은 소비자의 체험을 바꾸지 않으면서 순탄수화물을 줄이고 소화기계에 대한 이점을 높임으로써 영양가를 향상시키기 위해 일상적인 식품 제품에 점점 더 통합되어 있습니다.
미국의 저항성 전분 시장은 2025년 32억 달러에 달했습니다. 강력한 혁신 능력, 첨단 연구 인프라, 효율적인 소매 유통망은 식이섬유 강화 식품 및 저혈당 식품의 신속한 상용화를 지원합니다.
목차
제1장 조사 방법과 범위
제2장 주요 요약
제3장 업계 인사이트
생태계 분석
공급자의 상황
이익률
각 단계에서의 부가가치
밸류체인에 영향을 주는 요인
혁신
업계에 미치는 영향요인
성장 요인
당뇨병 및 비만 유병률 증가
클린 라벨 및 천연 원료에 대한 기호
장내 환경과 프리바이오틱스의 인지도 향상
업계의 잠재적 위험 및 과제
기존 전분과 비교해 높은 비용
소비자의 낮은 인지도와 이해도
시장 기회
식물성 식품 및 비건 식품으로 사업 확대
의료 및 임상 영양 분야에서의 이용
성장 가능성 분석
규제 상황
북미
유럽
아시아태평양
라틴아메리카
중동 및 아프리카
Porter's Five Forces 분석
PESTEL 분석
가격 동향
지역별
제품별
미래 시장 동향
기술과 혁신 동향
현재의 기술 동향
신흥기술
특허 상황
무역 통계(HS코드)(참고 : 무역 통계는 주요 국가에서만 제공됨)
주요 수입국
주요 수출국
지속가능성과 환경면
지속가능한 대처
폐기물 감축 전략
생산에서의 에너지 효율
환경에 배려한 대처
탄소발자국 고려
제4장 경쟁 구도
소개
기업의 시장 점유율 분석
지역별
북미
유럽
아시아태평양
라틴아메리카
중동 및 아프리카
기업 매트릭스 분석
주요 시장 기업의 경쟁 분석
경쟁 포지셔닝 매트릭스
주요 발전
인수합병
제휴 및 협업
신제품 발매
사업 확대 계획
제5장 시장 추계 및 예측 : 원료/생물종별, 2022-2035년
곡물
쌀
밀
수수
사고
기타 곡물
야채
찰옥수수
타피오카
완두콩
기타 야채
기타 원료
제6장 시장 추계 및 예측 : 제품별, 2022-2035년
RS1
RS2
RS3
RS4
RS5
제7장 시장 추계 및 예측 : 용도별, 2022-2035년
유제품
베이커리 제품
빵
쿠키
비스킷
기타
당과류
영양 바
기타
즉석 식품
국수
파스타
시리얼
크래커
수프
기타
제8장 시장 추계 및 예측 : 지역별, 2022-2035년
북미
미국
캐나다
유럽
독일
영국
프랑스
스페인
이탈리아
기타 유럽
아시아태평양
중국
인도
일본
호주
한국
기타 아시아태평양
라틴아메리카
브라질
멕시코
아르헨티나
기타 라틴아메리카
중동 및 아프리카
사우디아라비아
남아프리카
아랍에미리트(UAE)
기타 중동 및 아프리카
제9장 기업 프로파일
Xian Kono Chem
SunOpta
MSPrebiotics
Sheekharr Starch Private Limited
AGRANA Beteiligungs
Natural Stacks
Gut Garden
ADM
Roquette Freres
Arcadia Biosciences
Tate & Lyle
MGP Ingredients Inc.
Ingredion Incorporated
Cargill
JHS
영문 목차
영문목차
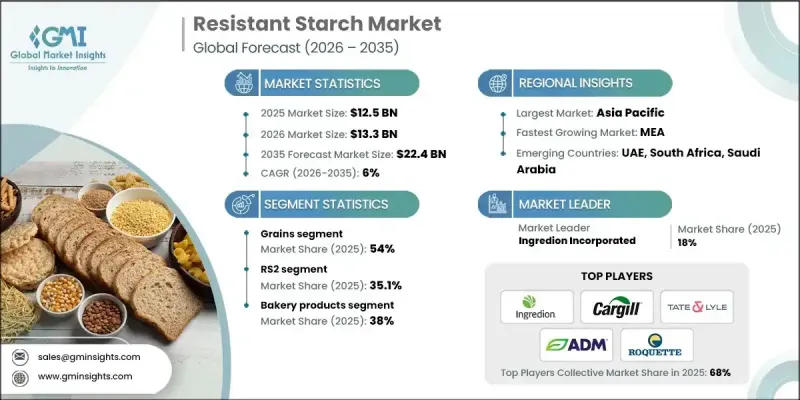
The Global Resistant Starch Market was valued at USD 12.5 billion in 2025 and is estimated to grow at a CAGR of 6% to reach USD 22.4 billion by 2035.
Market growth has been strongly influenced by rising rates of metabolic health conditions, which have prompted food producers to redesign formulations with improved nutritional profiles. Resistant starch has gained attention as it allows manufacturers to enhance fiber content and reduce glycemic impact while maintaining the familiar taste and texture of everyday food products. Its functional benefits related to digestive wellness, prolonged satiety, and blood sugar moderation have increased its use across multiple food categories. Between 2021 and 2025, raw material availability and processing efficiency supported large-scale production, particularly from widely cultivated crops. At the same time, producers explored alternative raw material streams to align with sustainability goals and clean-label positioning. Different types of resistant starch gained traction based on functional suitability, with naturally occurring and retrograded variants receiving stronger market acceptance compared to chemically modified options. These combined trends continue to support broad adoption across global food and nutrition markets.
Market Scope
Start Year
2025
Forecast Year
2026-2035
Start Value
$12.5 Billion
Forecast Value
$22.4 Billion
CAGR
6%
The grains segment accounted for 54% share in 2025 and is expected to grow at a CAGR of 5.1% through 2035. Demand is being driven by preference for familiar crop sources and regional availability, particularly in Asia Pacific markets. Grain- and vegetable-derived resistant starches are also gaining attention for their suitability in clean-label, non-GMO, and functional food applications.
The bakery products segment held 38% share in 2025 and is projected to grow at a CAGR of 6% through 2035. Resistant starch is increasingly incorporated into everyday food products to subtly improve nutritional value by lowering net carbohydrates and enhancing digestive benefits without altering consumer experience.
US Resistant Starch Market reached USD 3.2 billion in 2025. Strong innovation capabilities, advanced research infrastructure, and efficient retail distribution support the rapid commercialization of fiber-enriched and low-glycemic food products.
Key companies operating in the Global Resistant Starch Market include Cargill, Ingredion Incorporated, Tate & Lyle, Roquette Freres, ADM, SunOpta, AGRANA Beteiligungs, MGP Ingredients Inc., Arcadia Biosciences, Xian Kono Chem, MSPrebiotics, Sheikharr Starch Private Limited, Natural Stacks, and Gut Garden. Companies in the Global Resistant Starch Market are strengthening their competitive position through continuous investment in research, formulation science, and application-specific solutions. Many players are expanding portfolios with clean-label and naturally sourced resistant starches to meet evolving consumer expectations. Strategic collaborations with food manufacturers enable faster integration into mainstream products. Firms are also focusing on supply chain optimization and sustainable sourcing to improve efficiency and transparency.
Table of Contents
Chapter 1 Methodology & Scope
1.1 Market scope and definition
1.2 Research design
1.2.1 Research approach
1.2.2 Data collection methods
1.3 Data mining sources
1.3.1 Global
1.3.2 Regional/Country
1.4 Base estimates and calculations
1.4.1 Base year calculation
1.4.2 Key trends for market estimation
1.5 Primary research and validation
1.5.1 Primary sources
1.6 Forecast model
1.7 Research assumptions and limitations
Chapter 2 Executive Summary
2.1 Industry 3600 synopsis
2.2 Key market trends
2.2.1 Regional
2.2.2 Source / Organism Type
2.2.3 Product
2.2.4 Application
2.3 TAM Analysis, 2026-2035
2.4 CXO perspectives: Strategic imperatives
2.4.1 Executive decision points
2.4.2 Critical success factors
2.5 Future Outlook and Strategic Recommendations
Chapter 3 Industry Insights
3.1 Industry ecosystem analysis
3.1.1 Supplier landscape
3.1.2 Profit margin
3.1.3 Value addition at each stage
3.1.4 Factor affecting the value chain
3.1.5 Disruptions
3.2 Industry impact forces
3.2.1 Growth drivers
3.2.1.1 Rising diabetes and obesity prevalence
3.2.1.2 Clean-label and natural ingredient preference
3.2.1.3 Growing gut health and prebiotic awareness
3.2.2 Industry pitfalls and challenges
3.2.2.1 Higher cost versus conventional starches
3.2.2.2 Limited consumer awareness and understanding
3.2.3 Market opportunities
3.2.3.1 Expansion into plant-based and vegan foods
3.2.3.2 Use in medical and clinical nutrition
3.3 Growth potential analysis
3.4 Regulatory landscape
3.4.1 North America
3.4.2 Europe
3.4.3 Asia Pacific
3.4.4 Latin America
3.4.5 Middle East & Africa
3.5 Porter's analysis
3.6 PESTEL analysis
3.7 Price trends
3.7.1 By region
3.7.2 By Product
3.8 Future market trends
3.9 Technology and Innovation landscape
3.9.1 Current technological trends
3.9.2 Emerging technologies
3.10 Patent Landscape
3.11 Trade statistics (HS code) ( Note: The trade statistics will be provided for key countries only)
3.11.1 Major importing countries
3.11.2 Major exporting countries
3.12 Sustainability and environmental aspects
3.12.1 Sustainable practices
3.12.2 Waste reduction strategies
3.12.3 Energy efficiency in production
3.12.4 Eco-friendly initiatives
3.13 Carbon footprint consideration
Chapter 4 Competitive Landscape, 2025
4.1 Introduction
4.2 Company market share analysis
4.2.1 By region
4.2.1.1 North America
4.2.1.2 Europe
4.2.1.3 Asia Pacific
4.2.1.4 LATAM
4.2.1.5 MEA
4.3 Company matrix analysis
4.4 Competitive analysis of major market players
4.5 Competitive positioning matrix
4.6 Key developments
4.6.1 Mergers & acquisitions
4.6.2 Partnerships & collaborations
4.6.3 New Product Launches
4.6.4 Expansion Plans
Chapter 5 Market Estimates and Forecast, By Source / Organism Type, 2022-2035 (USD Billion) (Kilo Tons)
5.1 Key trends
5.2 Grains
5.2.1 Rice
5.2.2 Wheat
5.2.3 Sorghum
5.2.4 Sago
5.2.5 Other grains
5.3 Vegetables
5.3.1 Waxy corn
5.3.2 Tapioca
5.3.3 Pea
5.3.4 Other vegetables
5.4 Other sources
Chapter 6 Market Estimates and Forecast, By Product, 2022-2035 (USD Billion) (Kilo Tons)
6.1 Key trends
6.2 RS1
6.3 RS2
6.4 RS3
6.5 RS4
6.6 RS5
Chapter 7 Market Estimates and Forecast, By Application, 2022-2035 (USD Billion) (Kilo Tons)
7.1 Key trends
7.2 Dairy products
7.3 Bakery products
7.3.1 Bread
7.3.2 Cookies
7.3.3 Biscuits
7.3.4 Others
7.4 Sugar confections
7.4.1 Nutrition Bars
7.4.2 Others
7.5 Convenience foods
7.5.1 Noodles
7.5.2 Pasta
7.5.3 Breakfast Cereals
7.5.4 Crackers
7.5.5 Soup
7.5.6 Others
Chapter 8 Market Estimates and Forecast, By Region, 2022-2035 (USD Billion) (Kilo Tons)