전력 품질 측정기 시장 : 시장 기회, 성장 촉진요인, 산업 동향 분석, 예측(2026-2035년)
Power Quality Meter Market Opportunity, Growth Drivers, Industry Trend Analysis, and Forecast 2026 - 2035
상품코드:1913365
리서치사:Global Market Insights Inc.
발행일:2025년 12월
페이지 정보:영문 180 Pages
라이선스 & 가격 (부가세 별도)
ㅁ Add-on 가능: 고객의 요청에 따라 일정한 범위 내에서 Customization이 가능합니다. 자세한 사항은 문의해 주시기 바랍니다.
한글목차
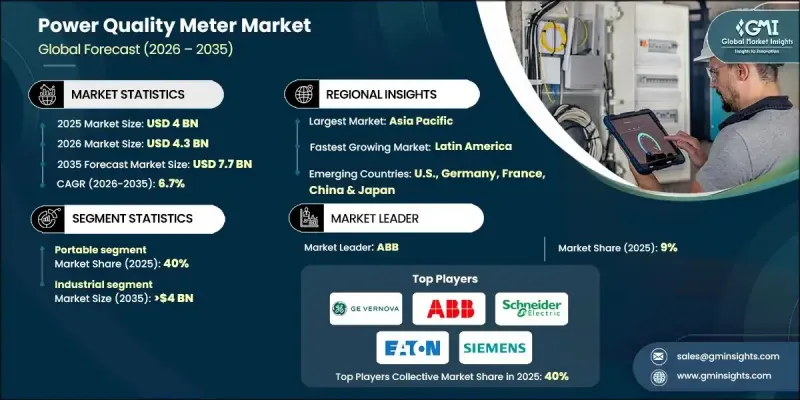
세계의 전력 품질 측정기 시장은 2025년에 40억 달러로 평가되었고, 2035년까지 연평균 복합 성장률(CAGR) 6.7%로 성장할 전망이며, 77억 달러에 이를 것으로 예측됩니다.
다양한 산업 분야에서 정밀 전자기기의 도입 확대가 장애나 기기 손상을 방지하기 위한 본 측정기 수요를 견인하고 있습니다. 스마트 그리드의 보급 확대 및 재생에너지원의 확대가 함께 시장 역학을 재구성하고 있습니다. 에너지 효율화 시책과 규제 강화가 도입을 더욱 가속화하고 있습니다. 전력 품질 측정기는 복잡한 송전망에서 전압 강하, 고조파 및 기타 장애를 감지하는 데 필수적입니다. 실시간 통신 기능을 갖춘 이 계측기는 예지 보전 및 신속한 고장 분석을 가능하게 합니다. 클라우드 기반 데이터 관리로의 마이그레이션은 모든 기기에서 원활한 모니터링, 추세 시각화, 보고서 생성 및 알림 알림을 제공합니다. 유틸리티 및 산업이 안정적이고 신뢰할 수 있는 전력 공급 확보에 주력하는 가운데 사이버 보안에 대한 우려 증가 및 전력 품질 기준의 엄격화가 시장 성장을 지원할 것으로 예측됩니다.
시장 범위
시작 연도
2025년
예측 기간
2026-2035년
당초 시장 규모
40억 달러
시장 규모 예측
77억 달러
CAGR
6.7%
휴대용 전력 품질 측정기 부문은 2025년에 40%의 점유율을 차지하였고, 2035년까지 연평균 복합 성장률(CAGR) 6.5%로 성장할 것으로 예측됩니다. 도시화 진전, 소규모 산업의 근대화를 위한 정부 대처, 전기 시스템의 복잡화가 진행되는 것이 수요를 뒷받침하고 있습니다. 이 측정기는 조직이 에너지 효율성을 낮추고 사용을 간소화하며 운영 비용을 줄이는 데 도움이 됩니다.
산업용 전력 품질 측정기 부문은 2025년에 57.9%의 점유율을 차지하였으며, 2035년까지 40억 달러 규모에 달할 것으로 예측되고 있습니다. 고속 제조 공정에서는 안정적인 전력 공급이 필수적이며, 이러한 계기는 기계의 연속 가동을 보장함으로써 일관된 생산성과 품질 기준의 유지를 지원합니다.
북미의 전력 품질 측정기 시장은 2035년까지 15억 달러 규모에 이를 것으로 예측됩니다. 이 지역의 전력회사는 노후화되는 인프라와 기상 관련 장애 증가에 대응하기 위해 송전망의 신뢰성 향상, 전압 변동 관리, 고장 검출, 응답 시간 개선을 목적으로 고급 모니터링 시스템에 대한 투자를 적극적으로 추진하고 있습니다.
목차
제1장 분석 방법 및 범위
제2장 주요 요약
제3장 업계 인사이트
생태계 분석
원재료 가용성 및 조달 분석
제조 능력 평가
공급망의 회복력 및 리스크 요인
유통 네트워크 분석
규제 상황
업계에 미치는 영향요인
성장 촉진요인
업계의 잠재적 위험 및 과제
성장 가능성 분석
Porter's Five Forces 분석
PESTEL 분석
전력 품질 측정기의 비용 구조 분석
가격 동향 분석(단위 : 달러 및 대)
지역별
제품별
새로운 기회 및 동향
디지털화 및 IoT 통합
신흥 시장 진출
투자분석 및 전망
제4장 경쟁 구도
서문
기업별 시장 점유율 분석
북미
유럽
아시아태평양
중동 및 아프리카
라틴아메리카
전략적 대시보드
전략적 노력
주요 제휴 및 협력 관계
주요 M&A 활동
제품 혁신 및 신제품 출시
시장 확대 전략
경쟁 벤치마킹
혁신 및 지속가능성의 정세
제5장 시장 규모 및 예측 : 제품별(2022-2035년)
휴대형
패널 장착형
제6장 시장 규모 및 예측 : 용도별(2022-2035년)
상업용
산업용
유틸리티
제7장 시장 규모 및 예측 : 상별(2022-2035년)
단상
삼상
제8장 시장 규모 및 예측 : 통신 방식별(2022-2035년)
유선
무선
제9장 시장 규모 및 예측 : 지역별(2022-2035년)
북미
미국
캐나다
멕시코
유럽
독일
프랑스
러시아
영국
이탈리아
스페인
네덜란드
오스트리아
아시아태평양
중국
일본
한국
인도
호주
뉴질랜드
말레이시아
인도네시아
중동 및 아프리카
사우디아라비아
아랍에미리트(UAE)
카타르
이집트
남아프리카
나이지리아
쿠웨이트
오만
라틴아메리카
브라질
페루
아르헨티나
제10장 기업 프로파일
ABB
Accuenergy
Algodue Elettronica
Delta Electronics
Eastron Electronic
Eaton
Elspec
Emerson Electric
Fluke Corporation
GE Vernova
Honeywell International
HIOKI EE CORPORATION
LUMEL
MB Control &Systems
Megger
Mitsubishi Electric Corporation
MTE Power Quality
PCE Instruments
Phoenix Contact
Rishabh Instruments
Rockwell Automation
Schneider Electric
Siemens
Vitrek
AJY
영문 목차
영문목차
The Global Power Quality Meter Market was valued at USD 4 billion in 2025 and is estimated to grow at a CAGR of 6.7% to reach USD 7.7 billion by 2035.
The growing deployment of precision electronics across diverse industries is driving demand for these meters to prevent disruptions and equipment damage. The increasing adoption of smart grids, coupled with the expansion of renewable energy sources, is reshaping market dynamics. Energy efficiency initiatives and stricter regulatory mandates are further accelerating adoption. Power quality meters are essential for detecting voltage sags, harmonics, and other disturbances in complex grid networks. Equipped with real-time communication capabilities, these meters enable predictive maintenance and rapid fault analysis. The shift toward cloud-based data management allows seamless monitoring, trend visualization, report generation, and alerts from any device. Rising cybersecurity concerns and stricter power quality standards are expected to support market growth, as utilities and industries focus on ensuring a stable and reliable electricity supply.
Market Scope
Start Year
2025
Forecast Year
2026-2035
Start Value
$4 Billion
Forecast Value
$7.7 Billion
CAGR
6.7%
The portable power quality meter segment held 40% share in 2025 and is projected to grow at a CAGR of 6.5% through 2035. Rising urbanization, government initiatives to modernize small-scale industries, and the growing complexity of electrical systems are fueling demand. These meters help organizations identify energy inefficiencies, streamline usage, and reduce operational costs.
The industrial power quality meter segment held 57.9% share in 2025 and is expected to reach USD 4 billion by 2035. High-speed manufacturing operations rely on stable electrical supplies, and these meters ensure machinery operates without interruption, supporting consistent production and quality standards.
North America Power Quality Meter Market is projected to reach USD 1.5 billion by 2035. Utilities in the region are investing heavily in advanced monitoring systems to enhance grid reliability, manage voltage fluctuations, detect faults, and improve response times amid aging infrastructure and increasing weather-related disruptions.
Key players in the Global Power Quality Meter Market include Fluke Corporation, Schneider Electric, ABB, Phoenix Contact, Siemens, Eaton, Emerson Electric, Accuenergy, Rishabh Instruments, Honeywell International, Delta Electronics, LUMEL, MTE Power Quality, Megger, PCE Instruments, Vitrek, HIOKI E.E. CORPORATION, Elspec, M B Control & Systems, Algodue Elettronica, Eastron Electronic, Mitsubishi Electric Corporation, and GE Vernova. Companies in the Global Power Quality Meter Market are strengthening their presence through multiple strategies. They focus on investing in R&D to enhance meter accuracy, connectivity, and predictive maintenance capabilities. Strategic partnerships with utilities and industrial players help expand market reach and integration with smart grid solutions. Firms are also improving after-sales support, software platforms, and mobile/cloud-based monitoring services to increase customer value.
Table of Contents
Chapter 1 Methodology & Scope
1.1 Research design
1.1.1 Research approach
1.1.2 Data collection methods
1.2 Base estimates and calculations
1.2.1 Base year calculation
1.2.2 Market estimates & forecast parameters
1.3 Forecast model
1.3.1 Key trends for market estimates
1.3.2 Quantified market impact analysis
1.3.2.1 Mathematical impact of growth parameters on forecast
1.3.3 Scenario analysis framework
1.4 Primary research and validation
1.4.1 Some of the primary sources (but not limited to)
1.5 Data mining sources
1.5.1 Paid Sources
1.5.2 Sources, by region
1.6 Research trail & scoring components
1.6.1 Research trail components
1.6.2 Scoring components
1.7 Research transparency addendum
1.7.1 Source attribution framework
1.7.2 Quality assurance metrics
1.7.3 Our commitment to trust
1.8 Market definitions
Chapter 2 Executive Summary
2.1 Industry synopsis, 2022 - 2035
2.1.1 Business trends
2.1.2 Product trends
2.1.3 Application trends
2.1.4 Phase trends
2.1.5 Communication trends
2.1.6 Regional trends
Chapter 3 Industry Insights
3.1 Industry ecosystem analysis
3.1.1 Raw material availability & sourcing analysis
3.1.2 Manufacturing capacity assessment
3.1.3 Supply chain resilience & risk factors
3.1.4 Distribution network analysis
3.2 Regulatory landscape
3.3 Industry impact forces
3.3.1 Growth drivers
3.3.2 Industry pitfalls & challenges
3.4 Growth potential analysis
3.5 Porter's analysis
3.5.1 Bargaining power of suppliers
3.5.2 Bargaining power of buyers
3.5.3 Threat of new entrants
3.5.4 Threat of substitutes
3.6 PESTEL analysis
3.6.1 Political factors
3.6.2 Economic factors
3.6.3 Social factors
3.6.4 Technological factors
3.6.5 Legal factors
3.6.6 Environmental factors
3.7 Cost structure analysis of power quality meters
3.8 Price trend analysis (USD/Unit)
3.8.1 By region
3.8.2 By product
3.9 Emerging opportunities & trends
3.9.1 Digitalization & IoT integration
3.9.2 Emerging market penetration
3.10 Investment analysis & future outlook
Chapter 4 Competitive Landscape, 2025
4.1 Introduction
4.2 Company market share analysis, by region, 2025
4.2.1 North America
4.2.2 Europe
4.2.3 Asia Pacific
4.2.4 Middle East & Africa
4.2.5 Latin America
4.3 Strategic dashboard
4.4 Strategic initiatives
4.4.1 Key partnerships & collaborations
4.4.2 Major M&A activities
4.4.3 Product innovations & launches
4.4.4 Market expansion strategies
4.5 Competitive benchmarking
4.6 Innovation & sustainability landscape
Chapter 5 Market Size and Forecast, By Product, 2022 - 2035 (USD Million & Units)
5.1 Key trends
5.2 Portable
5.3 Panel mounted
Chapter 6 Market Size and Forecast, By Application, 2022 - 2035 (USD Million & Units)
6.1 Key trends
6.2 Commercial
6.3 Industrial
6.4 Utility
Chapter 7 Market Size and Forecast, By Phase, 2022 - 2035 (USD Million & Units)
7.1 Key trends
7.2 Single phase
7.3 Three phase
Chapter 8 Market Size and Forecast, By Communication, 2022 - 2035 (USD Million & Units)
8.1 Key trends
8.2 Wired
8.3 Wireless
Chapter 9 Market Size and Forecast, By Region, 2022 - 2035 (USD Million & Units)