Food Phosphate Market Opportunity, Growth Drivers, Industry Trend Analysis, and Forecast 2026 - 2035
상품코드:1892846
리서치사:Global Market Insights Inc.
발행일:2025년 12월
페이지 정보:영문 300 Pages
라이선스 & 가격 (부가세 별도)
ㅁ Add-on 가능: 고객의 요청에 따라 일정한 범위 내에서 Customization이 가능합니다. 자세한 사항은 문의해 주시기 바랍니다.
한글목차
세계의 식품용 인산염 시장은 2025년에 59억 달러로 평가되었고, 2035년까지 연평균 복합 성장률(CAGR) 7.3%로 성장하여 119억 달러에 이를 것으로 예측됩니다.
시장 성장은 품질, 균일성, 보존 안정성을 유지하기 위해 기능성 첨가제에 의존하는 가공식품 및 포장식품 수요가 꾸준히 증가하고 있는 데 따른 것입니다. 널리 상용화된 나트륨계, 칼륨계, 칼슘계를 포함한 식품용 인산염은 대규모 식품 제조에서 식감 개선, 수분 유지, 배합 안정성 유지에 중요한 역할을 하고 있습니다. 급속한 도시화, 식습관의 변화, 시간적 제약이 있는 라이프스타일로 인해 편의식품의 소비가 지속적으로 증가하고 있으며, 이는 장기적인 수요를 강화시키고 있습니다. 아시아태평양은 인구 증가, 도시 지역의 식품 소비 확대, 포장 식품의 급속한 보급에 힘입어 수량 기준으로 세계 시장을 선도하고 있습니다. 북미에서는 선진적인 식품 가공 인프라를 바탕으로 단백질 가공품 및 제과 카테고리의 강력한 수요에 힘입어 더욱 빠르게 성장하고 있습니다. 가공식품 섭취량 증가, 산업 규모의 식품 생산, 지속적인 배합 혁신의 융합은 세계 식품용 인산염 산업의 지속적인 확장에 유리한 조건을 계속 조성하고 있습니다.
시장 범위
개시 연도
2025년
예측 연도
2026-2035년
개시 연도 시장 규모
59억 달러
예측 금액
119억 달러
CAGR
7.3%
폴리인산염 및 축합인산염 부문은 2025년 42.2%의 점유율을 차지할 것으로 예상되며, 2035년까지 연평균 7.1%의 성장률을 보일 것으로 예측됩니다. 그 장점은 보습성, 원료 안정화, 제품 일관성 향상과 같은 다기능 성능 특성에 기인하며, 다양한 식품 가공 응용 분야에서 폭넓게 채택되고 있습니다.
분말 식품용 인산염 부문은 저장 안정성, 취급 용이성, 대량 생산 공정과의 적합성 등으로 인해 2025년 45.1%의 점유율을 차지할 것으로 예측됩니다. 다양한 식품 배합에서 안정적인 성능이 견고한 수요를 뒷받침하는 한편, 용해도 제어가 필요한 응용 분야에서는 대체 물리적 형태의 채택이 계속 확대되고 있습니다.
북미 식품용 인산염 시장은 2026년부터 2035년까지 연평균 복합 성장률(CAGR) 7.2%를 보일 것으로 예측됩니다. 환경적으로 효율적인 생산방식의 지속적인 발전과 지속가능성에 초점을 맞춘 제조방식과의 일치성이 높아지면서 지역 수요 패턴을 형성하고 있습니다.
목차
제1장 조사 방법과 범위
제2장 주요 요약
제3장 업계 인사이트
생태계 분석
공급업체 상황
이익률
각 단계별 부가가치
밸류체인에 영향을 미치는 요인
파괴적 변화
업계에 대한 영향요인
성장 촉진요인
업계의 잠재적 리스크&과제
성장 가능성 분석
규제 상황
북미
유럽
아시아태평양
라틴아메리카
중동 및 아프리카
Porter's Five Forces 분석
PESTEL 분석
가격 동향
지역별
제품별
향후 시장 동향
기술과 혁신 동향
현재 기술 동향
신기술
특허 상황
무역 통계(HS코드)(주 : 무역 통계는 주요 국가에 한해 제공됩니다)
주요 수입국
주요 수출국
지속가능성과 환경 측면
지속가능한 대처
폐기물 감축 전략
생산 에너지 효율
친환경 이니셔티브
탄소발자국 고려
제4장 경쟁 구도
서론
기업의 시장 점유율 분석
지역별
북미
유럽
아시아태평양
라틴아메리카
중동 및 아프리카
기업 매트릭스 분석
주요 시장 기업의 경쟁 분석
경쟁 포지셔닝 매트릭스
주요 발전
인수합병(M&A)
제휴 및 협업
신제품 발매
사업 확대 계획
제5장 시장 추산 및 예측 : 제품별, 2022-2035
주요 동향
오르토 인산염
Sodium orthophosphates
Potassium orthophosphates
Calcium orthophosphates
Magnesium phosphates
Ammonium phosphates
폴리 인산염 및 축합 인산염
피로인산염(이인산염)
삼인산염
헥사메타인산염
트리메타인산염
인산(식품 등급)
기타
제6장 시장 추산 및 예측 : 형태별, 2022-2035
주요 동향
분말
과립
액체 및 용액
기타
제7장 시장 추산 및 예측 : 용도별, 2022-2035
주요 동향
육류 및 수산가공품
신선 및 냉동 육류
가공육 및 훈제육
가금육 제품
수산물 및 생선 제품
기타
베이커리
빵·롤빵
케이크·페이 파업 리
비스킷·쿠키
베이킹파우다·믹스
기타
유제품
아이스크림 및 냉동 디저트
가공치즈 및 치즈 스프레드
요구르트 및 발효유 제품
기타
음료
과일 주스 및 넥타
탄산음료
스포츠 드링크 및 에너지 드링크
커피 크리머 및 화이트너
기타
가공 식품 및 간편 식품
레디밀
수프 및 소스
인스턴트 라면
기타
제과
캔디 및 제과
추잉껌
기타
기타
제8장 시장 추산 및 예측 : 지역별, 2022-2035
주요 동향
북미
미국
캐나다
유럽
독일
영국
프랑스
스페인
이탈리아
기타 유럽
아시아태평양
중국
인도
일본
호주
한국
기타 아시아태평양
라틴아메리카
브라질
멕시코
아르헨티나
기타 라틴아메리카
중동 및 아프리카
사우디아라비아
남아프리카공화국
아랍에미리트(UAE)
기타 중동 및 아프리카
제9장 기업 개요
Aditya Birla Chemicals
FBC Industries, Inc
Fosfa A.S
ICL Group
Innophos, Inc
Nippon Chemical Industrial Co., Ltd.
Nutrien Ltd
Prayon
Sulux Phosphates
TKI Hrastnik
Xingfa Group
LSH
영문 목차
영문목차
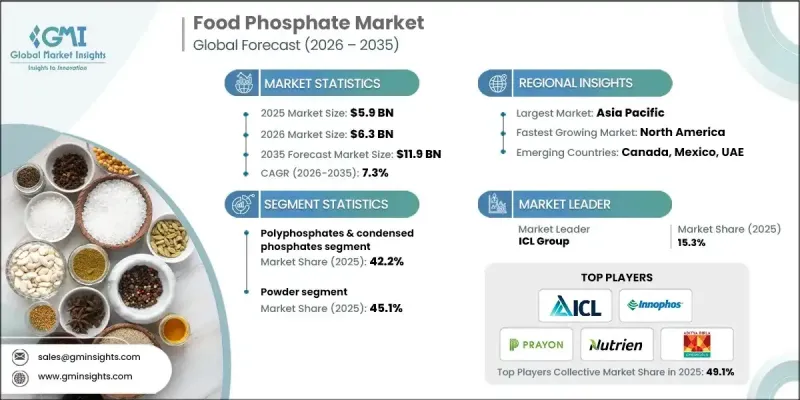
The Global Food Phosphate Market was valued at USD 5.9 billion in 2025 and is estimated to grow at a CAGR of 7.3% to reach USD 11.9 billion by 2035.
Market growth is supported by the steady rise in demand for processed and packaged food products that rely on functional additives to maintain quality, consistency, and shelf stability. Food phosphates, including widely commercialized sodium-, potassium-, and calcium-based variants, play a critical role in improving texture, maintaining moisture, and supporting formulation stability across large-scale food manufacturing. Rapid urbanization, changing dietary habits, and time-constrained lifestyles continue to increase the consumption of convenience foods, which strengthens long-term demand. Asia Pacific leads the global market in volume terms, supported by population growth, expanding urban food consumption, and the rapid penetration of packaged food formats. North America is showing faster expansion, driven by strong demand across protein processing and baked food categories, supported by advanced food processing infrastructure. The convergence of higher processed food intake, industrial-scale food production, and ongoing formulation innovation continues to create favorable conditions for the sustained expansion of the global food phosphate industry.
Market Scope
Start Year
2025
Forecast Year
2026-2035
Start Value
$5.9 Billion
Forecast Value
$11.9 Billion
CAGR
7.3%
The polyphosphates and condensed phosphates segment accounted for a 42.2% share in 2025 and is projected to grow at a CAGR of 7.1% through 2035. Their dominance is linked to multifunctional performance attributes such as moisture retention, ingredient stabilization, and improved product consistency, which support wide adoption across diverse food processing applications.
The powdered food phosphates segment held 45.1% share in 2025 due to their storage stability, ease of handling, and compatibility with high-volume manufacturing processes. Their consistent performance across multiple food formulations supports strong demand, while alternative physical forms continue to gain traction in applications requiring controlled solubility.
North America Food Phosphate Market is expected to grow at a CAGR of 7.2% from 2026 to 2035. Ongoing advancements in environmentally efficient production methods and increasing alignment with sustainability-focused manufacturing practices are shaping regional demand patterns.
Key companies active in the Global Food Phosphate Market include Prayon, Innophos, ICL Group, Nutrien Ltd, Aditya Birla Chemicals, Fosfa A.S, Nippon Chemical Industrial Co., Ltd., Xingfa Group, TKI Hrastnik, Sulux Phosphates, and FBC Industries, Inc. Companies operating in the Global Food Phosphate Market are strengthening their market position through capacity expansions, process optimization, and targeted investments in sustainable production technologies. Many players are focusing on improving product purity, functional performance, and formulation flexibility to align with evolving food manufacturing requirements. Strategic partnerships with food processors help secure long-term supply agreements and application-specific innovation. Geographic expansion into high-growth regions remains a priority to capture rising processed food demand. Additionally, companies are enhancing regulatory compliance capabilities and exploring alternative sourcing strategies to improve supply chain resilience and reinforce brand credibility in global markets.
Table of Contents
Chapter 1 Methodology & Scope
1.1 Market scope and definition
1.2 Research design
1.2.1 Research approach
1.2.2 Data collection methods
1.3 Data mining sources
1.3.1 Global
1.3.2 Regional/Country
1.4 Base estimates and calculations
1.4.1 Base year calculation
1.4.2 Key trends for market estimation
1.5 Primary research and validation
1.5.1 Primary sources
1.6 Forecast model
1.7 Research assumptions and limitations
Chapter 2 Executive Summary
2.1 Industry 360° synopsis
2.2 Key market trends
2.2.1 Regional
2.2.2 Product
2.2.3 Form
2.2.4 Application
2.3 TAM Analysis, 2026-2035
2.4 CXO perspectives: Strategic imperatives
2.4.1 Executive decision points
2.4.2 Critical success factors
2.5 Future Outlook and Strategic Recommendations
Chapter 3 Industry Insights
3.1 Industry ecosystem analysis
3.1.1 Supplier landscape
3.1.2 Profit margin
3.1.3 Value addition at each stage
3.1.4 Factor affecting the value chain
3.1.5 Disruptions
3.2 Industry impact forces
3.2.1 Growth drivers
3.2.1.1 Rising demand for processed & convenience foods
3.2.1.2 Growing meat & seafood processing industry
3.2.1.3 Expansion of bakery & confectionery sector
3.2.2 Industry pitfalls and challenges
3.2.2.1 Health concerns & negative perception of phosphate additives
3.2.2.2 Clean-label movement & consumer preference shift
3.2.3 Market opportunities
3.2.3.1 Development of clean-label phosphate solutions
3.2.3.2 Calcium-based phosphate alternatives for health-conscious consumers
3.3 Growth potential analysis
3.4 Regulatory landscape
3.4.1 North America
3.4.2 Europe
3.4.3 Asia Pacific
3.4.4 Latin America
3.4.5 Middle East & Africa
3.5 Porter's analysis
3.6 PESTEL analysis
3.7 Price trends
3.7.1 By region
3.7.2 By product
3.8 Future market trends
3.9 Technology and innovation landscape
3.9.1 Current technological trends
3.9.2 Emerging technologies
3.10 Patent Landscape
3.11 Trade statistics (HS code) ( Note: the trade statistics will be provided for key countries only)
3.11.1 Major importing countries
3.11.2 Major exporting countries
3.12 Sustainability and environmental aspects
3.12.1 Sustainable practices
3.12.2 Waste reduction strategies
3.12.3 Energy efficiency in production
3.12.4 Eco-friendly initiatives
3.13 Carbon footprint consideration
Chapter 4 Competitive Landscape, 2025
4.1 Introduction
4.2 Company market share analysis
4.2.1 By region
4.2.1.1 North America
4.2.1.2 Europe
4.2.1.3 Asia Pacific
4.2.1.4 LATAM
4.2.1.5 MEA
4.3 Company matrix analysis
4.4 Competitive analysis of major market players
4.5 Competitive positioning matrix
4.6 Key developments
4.6.1 Mergers & acquisitions
4.6.2 Partnerships & collaborations
4.6.3 New Product Launches
4.6.4 Expansion Plans
Chapter 5 Market Estimates and Forecast, By Product, 2022-2035 (USD Billion) (Kilo Tons)
5.1 Key trends
5.2 Orthophosphates
5.2.1 Sodium orthophosphates
5.2.2 Potassium orthophosphates
5.2.3 Calcium orthophosphates
5.2.4 Magnesium phosphates
5.2.5 Ammonium phosphates
5.3 Polyphosphates & condensed phosphates
5.3.1 Pyrophosphates (diphosphates)
5.3.2 Tripolyphosphates
5.3.3 Hexametaphosphates
5.3.4 Trimetaphosphates
5.4 Phosphoric acid (food grade)
5.5 Others
Chapter 6 Market Estimates and Forecast, By Form, 2022-2035 (USD Billion) (Kilo Tons)
6.1 Key trends
6.2 Powder
6.3 Granular
6.4 Liquid & solution
6.5 Others
Chapter 7 Market Estimates and Forecast, By Application, 2022-2035 (USD Billion) (Kilo Tons)
7.1 Key trends
7.2 Meat & seafood processing
7.2.1 Fresh & frozen meat
7.2.2 Processed & cured meats
7.2.3 Poultry products
7.2.4 Seafood & fish products
7.2.5 Others
7.3 Bakery
7.3.1 Breads & rolls
7.3.2 Cakes & pastries
7.3.3 Biscuits & cookies
7.3.4 Baking powders & mixes
7.3.5 Others
7.4 Dairy
7.4.1 Ice cream & frozen desserts
7.4.2 Processed cheese & cheese spreads
7.4.3 Yogurt & cultured products
7.4.4 Others
7.5 Beverages
7.5.1 Fruit juices & nectars
7.5.2 Carbonated soft drinks
7.5.3 Sports & energy drinks
7.5.4 Coffee creamers & whiteners
7.5.5 Others
7.6 Processed & convenience foods
7.6.1 Ready meals
7.6.2 Soups & sauces
7.6.3 Instant noodles
7.6.4 Others
7.7 Confectionery
7.7.1 Candies & sweets
7.7.2 Chewing gum
7.7.3 Others
7.8 Others
Chapter 8 Market Estimates and Forecast, By Region, 2022-2035 (USD Billion) (Kilo Tons)