


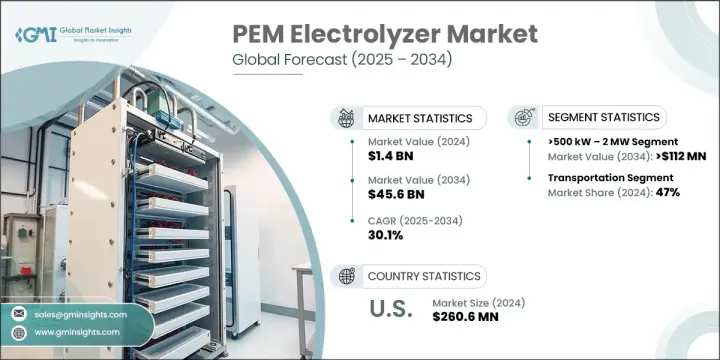
PEM 전해조 세계 시장 규모는 2024년에 14억 달러로 평가되었고, CAGR 30.1%로 성장하여 2034년에는 456억 달러에 이를 것으로 추정됩니다.
이러한 성장의 주요 요인은 산업, 운송, 전력 분야에서 청정 수소에 대한 수요가 가속화되고 있기 때문입니다. 전 세계 산업계가 이산화탄소 배출량 감축을 목표로 하고 있는 가운데, 특히 정유, 철강, 암모니아 생산 등 에너지 다소비 부문에서는 저탄소 원료로의 전환이 필수적입니다.

PEM 전해조는 고순도 수소를 효율적으로 공급할 수 있는 능력과 변동하는 에너지 입력(특히 재생에너지원)에 대한 적합성으로 인해 큰 호응을 얻고 있습니다. 지원적인 정책, 배출가스 감축 의무, 수소 인프라에 대한 대규모 민관 투자로 수소 보급에 유리한 여건이 조성되고 있습니다. 가스 파이프라인 인프라와 유통망 개선으로 수소 공급 비용이 낮아져 PEM 시스템 도입이 더욱 촉진될 것으로 예측됩니다.
| 시장 범위 | |
|---|---|
| 개시 연도 | 2024년 |
| 예측 연도 | 2025-2034년 |
| 개시 금액 | 14억 달러 |
| 예측 금액 | 456억 달러 |
| CAGR | 30.1% |
PEM 전해조는 양성자 교환막을 통해 전기를 사용하여 물을 수소와 산소로 분해하는 방식으로 작동합니다. 변동 부하에 유연하게 대응할 수 있어 풍력, 태양광 등 재생에너지와의 통합에 이상적이며, 다양한 분야에서 신뢰할 수 있는 그린 수소 생산을 가능하게 합니다.
500kW-2MW의 용량 범위는 2034년까지 1억 1,200만 달러 이상에 달할 것으로 예측됩니다. 이러한 성장의 원동력은 이 부문의 확장성과 중규모 산업용 수소 제조에 대한 사용 증가입니다. 이 시스템은 효율적인 설치 공간과 적응성으로 인해 백업 전원이 필요한 시설, 주유소, 중규모 산업 사업장에서 특히 선호되고 있습니다. 크기와 출력의 균형이 잘 잡혀 있어 재생 에너지 발전, 전력 신뢰성, 현장 연료 발전과 같은 새로운 용도에 이상적인 솔루션이 될 수 있습니다.
운송 부문은 47%의 점유율을 차지하며, 2034년까지 연평균 복합 성장률(CAGR)은 24%로 예상됩니다. 수소 충전 인프라의 급속한 발전과 함께 연료전지 전기자동차의 개발이 증가함에 따라 모빌리티 솔루션에서 PEM 전해조에 대한 수요가 지속적으로 증가하고 있습니다. 고순도 수소를 생산할 수 있는 PEM 전해조는 지속가능성과 배출량 감소에 중점을 둔 운송 네트워크에 필수적이며, 대규모 그린 모빌리티 목표를 지원합니다.
유럽의 PEM 전해조 시장은 수소 개발에 대한 막대한 투자와 강력한 규제에 힘입어 2034년까지 175억 달러에 달할 것으로 예측됩니다. 이 지역은 다양한 분야에서 수소의 생산과 활용을 지원하기 위해 광범위한 인프라 구축을 추진하고 있습니다. 이러한 노력은 보다 광범위한 탈탄소화 목표에 부합하는 것으로, 공공 및 민간의 자금 지원으로 수소 관련 개발과 대규모 통합이 가속화되고 있습니다.
세계 PEM 전해조 시장을 형성하는 주요 기업으로는 Siemens Energy, Plug Power, Air Products & Chemicals, Cummins, Nel ASA 등이 있습니다. 시장 범위를 확대하고 경쟁력을 강화하기 위해 PEM 전해조 제조업체는 몇 가지 중점 전략을 채택하고 있습니다. 각 업체들은 증가하는 세계 수요에 대응하기 위해 제조 역량을 확대하고 공정 혁신을 통해 제조 비용을 낮추고 있습니다. 전력회사 및 재생에너지 발전 사업자와의 전략적 파트너십을 통해 전해조 배치와 청정 발전의 조화를 이루고 있습니다. 기업들은 또한 막의 내구성을 높이고, 에너지 소비를 줄이고, 시스템 효율을 높이기 위해 연구개발에 투자하고 있습니다. 또한, 기업들은 원료에 대한 접근성을 확보하고 수소 가치사슬의 세계 입지를 강화하기 위해 장기 공급 계약 및 합작 투자를 체결하고 있습니다.
The Global PEM Electrolyzer Market was valued at USD 1.4 billion in 2024 and is estimated to grow at a CAGR of 30.1% to reach USD 45.6 billion by 2034. This growth is largely fueled by the accelerating demand for clean hydrogen across industrial, transport, and power sectors. As global industries seek to lower carbon emissions, the shift toward low-carbon feedstock is becoming imperative, especially in energy-intensive sectors like refining, steel, and ammonia production.
Proton exchange membrane (PEM) electrolyzers are gaining significant traction due to their ability to deliver high-purity hydrogen efficiently and their compatibility with fluctuating energy inputs, particularly from renewable sources. Supportive policies, emission reduction mandates, and large-scale public-private investments in hydrogen infrastructure are creating favorable conditions for widespread adoption. Upgrades in gas pipeline infrastructure and distribution networks are expected to bring down the cost of hydrogen delivery, further promoting the adoption of PEM systems.
| Market Scope | |
|---|---|
| Start Year | 2024 |
| Forecast Year | 2025-2034 |
| Start Value | $1.4 Billion |
| Forecast Value | $45.6 Billion |
| CAGR | 30.1% |
PEM electrolyzers function by splitting water into hydrogen and oxygen using electricity via a proton exchange membrane. Their operational flexibility across variable loads makes them ideal for integration with renewable energy sources such as wind and solar, allowing for reliable green hydrogen production across multiple sectors.
The >500 kW - 2 MW capacity range is projected to exceed USD 112 million in value by 2034. This growth is fueled by the segment's scalability and increasing use in mid-scale industrial hydrogen production. These systems are especially favored in facilities requiring backup power, fueling stations, and medium-scale industrial operations due to their efficient footprint and adaptability. Their balance of size and output makes them an ideal solution for emerging applications in renewable energy integration, power reliability, and on-site fuel generation.
The transportation segment held a 47% share and is forecasted to grow at a CAGR of 24% through 2034. Increasing deployment of fuel cell electric vehicles, alongside rapid developments in hydrogen refueling infrastructure, continues to strengthen demand for PEM electrolyzers in mobility solutions. Their ability to produce high-purity hydrogen makes them essential for transportation networks focused on sustainability and emission reduction, supporting large-scale green mobility goals.
Europe PEM Electrolyzer Market will reach USD 17.5 billion by 2034, driven by considerable investments and strong regulatory backing for hydrogen development. The region is pushing forward with widespread infrastructure implementation to support hydrogen production and use across multiple sectors. These efforts align with broader decarbonization targets, with public and private funding accelerating hydrogen-related deployment and integration at scale.
Key companies shaping the Global PEM Electrolyzer Market include Siemens Energy, Plug Power, Air Products & Chemicals, Cummins, and Nel ASA. To expand their market reach and reinforce competitive positioning, PEM electrolyzer manufacturers are adopting several focused strategies. Companies are scaling their manufacturing capacities to meet growing global demand and lowering production costs through process innovation. Strategic partnerships with utility providers and renewable energy developers are helping align electrolyzer deployment with clean power generation. Businesses are also investing in R&D to enhance membrane durability, reduce energy consumption, and boost system efficiency. Additionally, firms are entering long-term supply agreements and joint ventures to secure raw material access and strengthen their hydrogen value chain presence globally.