


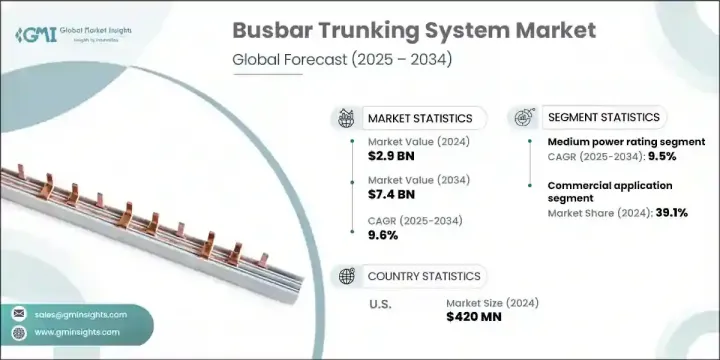
세계의 부스바 트렁킹 시스템 시장 규모는 2024년에 29억 달러로 평가되었고, CAGR 9.6%를 나타내 2034년에는 74억 달러에 이를 것으로 예측되고 있습니다.
산업 및 상업시설은 공간을 최적화하고 에너지 손실을 최소화하는 방법을 찾고 있기 때문에 효율적인 배전 솔루션에 대한 수요가 급속히 증가하고 있습니다. 부스바 트렁킹 시스템은 모듈식 설계, 설치 용이성 및 확장성을 통해 기존 케이블 배선보다 큰 이점을 제공하며 최신 인프라 프로젝트에 이상적인 솔루션이 되었습니다. 실시간 모니터링, 자동화 및 에너지 최적화에 중점을 둔 스마트 시티와 지능형 건물의 상승은 이러한 배전 시스템의 필요성을 더욱 높여줍니다.

게다가, 지속가능성의 동향의 높아짐과 소재의 혁신이, 배전의 장래를 형성하고 있습니다. 제조업체는 재활용 나일론 기반 부품인 TECHNYL 4EARTH와 같은 재료를 도입하여 세계 환경 기준을 충족하기 위해 보다 친환경 소재 및 생산 공정으로 전환하고 있습니다. 지속가능성이 중요해짐에 따라 친환경 솔루션을 채택한 기업은 경쟁 우위를 확보하고 투자를 불러들여 부스바 트렁킹 시스템 시장 수요를 끌어올리고 있습니다.
| 시장 범위 | |
|---|---|
| 시작 연도 | 2024년 |
| 예측 연도 | 2025-2034년 |
| 시작 금액 | 29억 달러 |
| 예측 금액 | 74억 달러 |
| CAGR | 9.6% |
중전력 정격 부스바 트렁킹 시스템 분야는 2024년에 29%의 점유율을 차지했고 2034년까지 연평균 복합 성장률(CAGR) 9.5%를 나타낼 것으로 예측됩니다. 일반적으로 800A-2,500A의 정격을 가진 이러한 시스템은 안전하고 효율적인 배전을 보장하기 위해 산업 및 인프라 분야에서 수요가 증가하고 있습니다. 샌드위치 절연 및 실시간 모니터링 기능과 같은 고급 기능을 갖춘 부스바 트렁킹 시스템은 디지털 인프라가 세계적으로 성장함에 따라 널리 보급되고 있습니다.
산업 용도 분야는 2034년까지 연평균 복합 성장률(CAGR) 9.5%를 나타낼 것으로 예측됩니다. 이 급성장의 주요 요인은 제조공장, 자동차공장, 물류허브 등의 중요한 산업환경에서 신뢰성이 높고 대용량의 배전시스템에 대한 수요가 증가하고 있다는 점입니다. 이러한 시설은 특히 무거운 기계, 복잡한 자동화 시스템, 고 에너지 요구 사항을 다루는 경우 원활한 작동을 유지하기 위해 무정전 전원에 크게 의존합니다. 산업이 계속 확대되고 진화하는 동안, 보다 효율적이고 확장 가능한 전원 솔루션이 시급해지고 있습니다.
미국의 부스바 트렁킹 시스템 시장은 71%의 점유율을 차지하며, 2024년에는 4억 2,000만 달러를 창출했습니다. 미국 시장의 꾸준한 성장의 원동력은 노후화된 전기 인프라의 현대화와 스마트 빌딩 기술의 채택 확대입니다. 이 지역에서는 에너지 효율, 화재 안전 및 모듈 건축이 중요하며 기존 케이블 배선 시스템에서보다 고급 부스바 트렁킹 솔루션으로의 전환이 가속화되었습니다.
부스바 트렁킹 시스템 시장의 주요 기업은 슈나이더 일렉트릭, 지멘스, ABB, 이튼 코퍼레이션, 르 그랑 등입니다. 부스바 트렁킹 시스템 업계의 각 회사는 시장에서의 지위를 강화하기 위해, 특히 에너지 효율, 확장성, 스마트 인프라와의 통합이라는 점에서 제품의 기술 혁신을 진행하는 데 주력하고 있습니다. 또한 규제의 압력과 소비자의 요구를 모두 충족하기 위해 많은 기업들이 환경 친화적인 소재와 프로세스로 전환하고 지속가능성을 우선시합니다. 전략적 파트너십, 합병 및 인수는 특히 스마트하고 지속 가능한 솔루션에 대한 수요가 계속 증가하는 동안 시장 범위와 능력을 확대하는 데 사용되는 주요 전략입니다. 또한, 각 회사는 버스 바 시스템의 성능을 강화하고 전반적인 고객 경험을 향상시키기 위해 연구 개발에 투자하고 있으며, 제품이 진화하는 업계의 요구에 부합하도록 노력하고 있습니다.
The Global Busbar Trunking System Market was valued at USD 2.9 billion in 2024 and is estimated to grow at a CAGR of 9.6% to reach USD 7.4 billion by 2034. The demand for efficient power distribution solutions is rapidly increasing, as industries and commercial facilities seek ways to optimize space and minimize energy losses. Busbar trunking systems offer a significant advantage over traditional cabling, with their modular design, ease of installation, and scalability making them an ideal solution for modern infrastructure projects. The rise of smart cities and intelligent buildings, which emphasize real-time monitoring, automation, and energy optimization, is further driving the need for these electrical distribution systems.
Furthermore, growing sustainability trends and innovations in materials are shaping the future of electrical distribution. Manufacturers are shifting towards more eco-friendly materials and production processes to meet global environmental standards, with the introduction of materials like TECHNYL 4EARTH, a recycled nylon-based component. As sustainability becomes a greater focus, companies adopting greener solutions are gaining competitive advantage, attracting investment, and boosting market demand for busbar trunking systems.
| Market Scope | |
|---|---|
| Start Year | 2024 |
| Forecast Year | 2025-2034 |
| Start Value | $2.9 Billion |
| Forecast Value | $7.4 Billion |
| CAGR | 9.6% |
The medium power rating busbar trunking systems segment held a 29% share in 2024 and is expected to grow at a CAGR of 9.5% through 2034. These systems, typically rated between 800A and 2500A, are increasingly sought after in industrial and infrastructure sectors, as they ensure safe and efficient power distribution. Busbar trunking systems with advanced features, such as sandwich insulation and real-time monitoring capabilities, are becoming more prevalent as digital infrastructure grows globally.
The industrial application segment is projected to grow at a CAGR of 9.5% through 2034. This surge is primarily driven by the increasing demand for reliable, high-capacity power distribution systems in critical industrial environments like manufacturing plants, automotive factories, and logistics hubs. These facilities rely heavily on uninterrupted power to maintain smooth operations, especially when dealing with heavy machinery, complex automation systems, and high-energy requirements. As industries continue to expand and evolve, there is a pressing need for more efficient and scalable power solutions, which busbar trunking systems are uniquely positioned to offer.
U.S. Busbar Trunking System Market held 71% share, generating USD 420 million in 2024. The steady growth of the market in the U.S. is driven by the modernization of aging electrical infrastructure and the increased adoption of smart building technologies. The region's emphasis on energy efficiency, fire safety, and modular construction is accelerating the shift from traditional cabling systems to more advanced busbar trunking solutions.
The top players in the Busbar Trunking System Market include Schneider Electric, Siemens, ABB, Eaton Corporation, and Legrand. To strengthen their market position, companies in the busbar trunking system industry focus on advancing product innovation, particularly in terms of energy efficiency, scalability, and integration with smart infrastructure. They also prioritize sustainability, with many shifting toward eco-friendly materials and processes in response to both regulatory pressures and consumer demand. Strategic partnerships, mergers, and acquisitions are key tactics used to expand market reach and capabilities, especially as demand for smart and sustainable solutions continues to rise. Additionally, companies are investing in research and development to enhance the performance of busbar systems and improve the overall customer experience, ensuring that their products align with evolving industry needs.