재료 수축 저감제 시장 기회, 성장 촉진요인, 산업 동향 분석 및 예측(2025-2034년)
Material Shrinkage-Reducing Agents Market Opportunity, Growth Drivers, Industry Trend Analysis, and Forecast 2025 - 2034
상품코드:1773454
리서치사:Global Market Insights Inc.
발행일:2025년 06월
페이지 정보:영문 220 Pages
라이선스 & 가격 (부가세 별도)
ㅁ Add-on 가능: 고객의 요청에 따라 일정한 범위 내에서 Customization이 가능합니다. 자세한 사항은 문의해 주시기 바랍니다.
한글목차
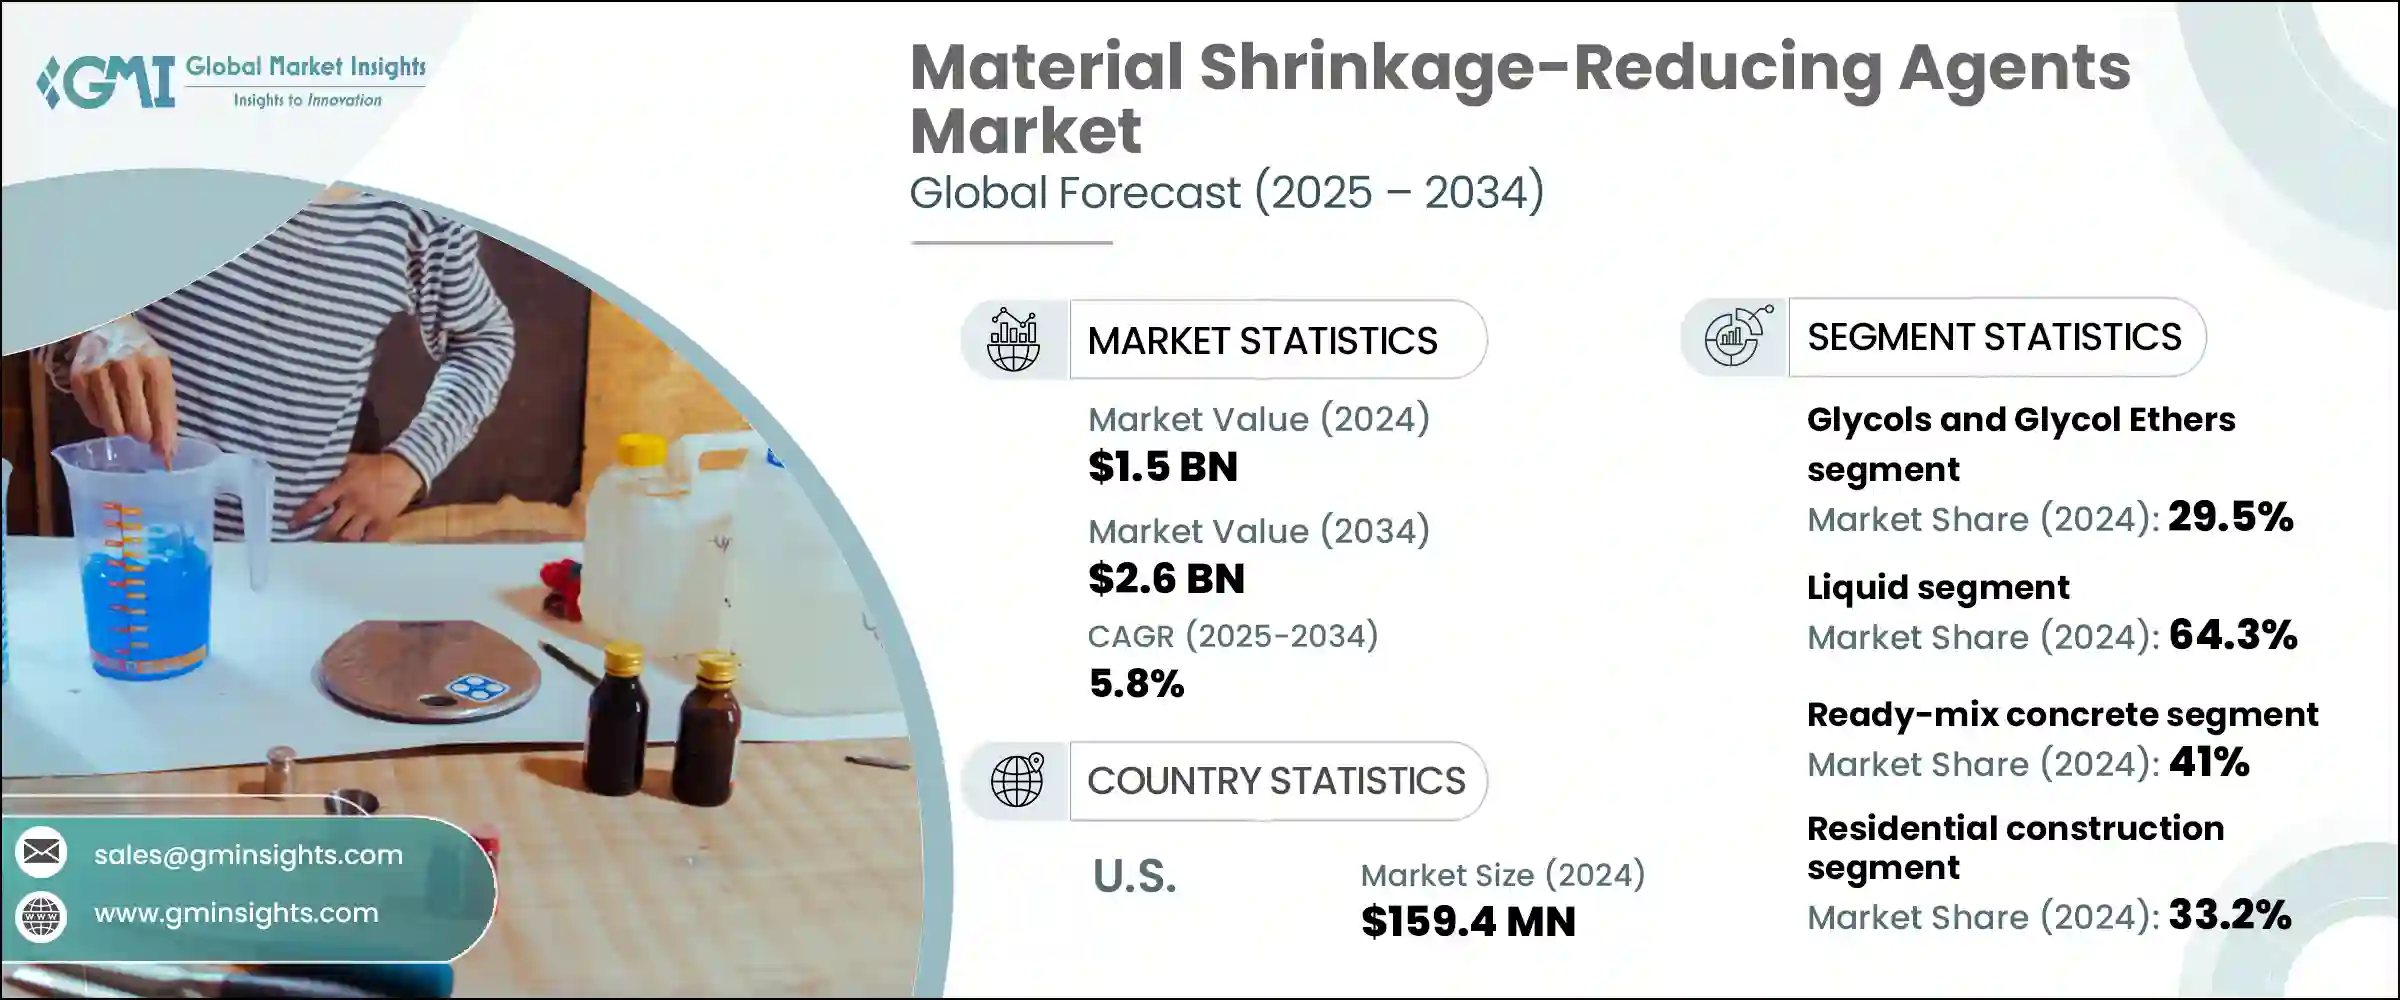
세계의 재료 수축 저감제시장은 2024년에 15억 달러로 평가되었고, CAGR 5.8%로 성장하여 2034년에는 26억 달러에 이를 것으로 추정되고 있습니다.
건축 기준이 구조적 강도와 장기적 성능을 우선시하는 방향으로 진화함에 따라 수축 저감제(SRA)는 단순한 첨가제에서 고성능 콘크리트 믹스의 필수 성분으로 변모하고 있습니다. 이러한 화학 솔루션은 수축과 관련된 균열을 최소화하고 콘크리트 강도를 유지하며 내구성을 향상시키는 데 중요한 역할을 합니다. 과거에는 수축에 대한 우려는 배합 비율을 변경하여 해결했지만, 오늘날 인프라 및 주택 건설에서 고급 재료에 대한 수요가 증가함에 따라 전 세계 시장에서 SRA의 채택이 가속화되고 있습니다.
이러한 성장은 급속한 산업화와 도시 개발로 인해 아시아태평양에서 특히 두드러지게 나타나고 있습니다. 지속가능성에 대한 강조와 차세대 혼화제로의 전환이 SRA의 사용을 가속화하고 있으며, 특히 균열 방지가 장기적인 유지보수 비용 절감에 필수적인 대규모 프로젝트에서 이러한 경향이 두드러지고 있습니다. 터널, 고층 구조물, 모듈식 설계 등 콘크리트의 용도가 다양해짐에 따라 SRA는 환경적 스트레스와 하중 하에서 성능을 유지하면서 구조물의 수명을 연장하는 데 중요한 역할을 하는 것으로 간주되고 있습니다.
시장 범위
개시 연도
2024년
예측 연도
2025-2034년
개시 금액
15억 달러
예측 금액
26억 달러
CAGR
5.8%
액상 SRA의 2024년 점유율은 64.3%였으며, 콘크리트 혼합물에 쉽게 혼입할 수 있는 장점으로 인해 강한 추진력을 보이고 있습니다. 효과적인 분산성과 레미콘과의 호환성으로 인해 인프라 및 대량 주택 건설에서 최고의 선택이 되고 있습니다. 이 약제는 일관된 수축 완화를 보장하며, 상업용 부동산 및 공공 부문 공사를 포함한 현장과 공장 모두에서 널리 사용되고 있습니다.
레미콘은 2024년 전체 시장의 41%를 차지하며 SRA의 주요 수요처로 부상했습니다. 이 약제는 특히 도시 지역의 주거 및 상업 개발에서 사용되는 레미콘에서 경화 과정에서 표면 균열 및 내부 응력의 위험을 줄이기 위해 필수적입니다. 프리캐스트 콘크리트 분야에서 SRA는 치수 정확도를 유지하고 재료의 수축으로 인해 발생할 수 있는 조립 오차를 방지하는 데 필수적입니다.
미국의 재료 수축 저감제 시장은 1억 5,940만 달러 규모로 85%의 점유율을 차지하고 있습니다. 이러한 선도적 지위는 탄탄한 인프라 활동과 지속 가능한 건설 관행에 대한 관심이 높아졌기 때문입니다. 정부 주도의 교량, 정부 복합시설, 교통 인프라 등 공공 자산의 개보수에 대한 정부 주도의 투자는 내구성과 균열에 강한 콘크리트에 대한 수요를 지속적으로 촉진하고 있습니다. 이에 따라 보수 및 유지관리 비용을 최소화하면서 콘크리트 구조물의 수명주기를 연장하고자 하는 건설사들 사이에서 SRA의 채택이 확대되고 있습니다. 또한, 환경 친화적인 건축 관행에 대한 노력도 첨단 혼화제 기술로의 전환을 가속화하고 있습니다.
재료 수축 저감제 시장의 주요 기업으로는 BASF SE, Mapei S.p.A., GCP Applied Technologies(Sangovan), Fosroc International Ltd., Sika AG 등이 있습니다. 재료 수축 저감제 시장의 기업들은 기술 혁신, 지역 확장, 지속가능성을 활용하여 시장 지위를 확보하고 있습니다. 주요 기업들은 녹색건축 인증에 부합하고 구조적 내구성을 향상시키는 친환경 SRA 개발에 주력하고 있습니다. 건설사 및 인프라 개발업체와의 전략적 제휴를 통해 이들 기업은 자사 제품을 장기 프로젝트에 직접 통합할 수 있습니다. R&D 투자는 다양한 환경 조건에서 배합 효율과 성능을 향상시키는 것을 목표로 하고 있습니다. 많은 기업들이 도시 건설 수요 증가에 대응하기 위해 아시아태평양과 같은 고성장 지역에서 생산 능력을 확장하고 있습니다.
목차
제1장 조사 방법과 범위
제2장 주요 요약
제3장 업계 인사이트
생태계 분석
공급업체 상황
이익률
각 단계에서의 부가가치
밸류체인에 영향을 미치는 요인
파괴적 변화
업계에 대한 영향요인
성장 촉진요인
업계의 잠재적 리스크&과제
시장 기회
성장 가능성 분석
규제 상황
북미
유럽
아시아태평양
라틴아메리카
중동 및 아프리카
Porter's Five Forces 분석
PESTEL 분석
가격 동향
지역별
제품별
향후 시장 동향
기술 및 혁신 상황
현재 기술 동향
신기술
특허 상황
무역 통계(HS코드)(주 : 무역 통계는 주요 국가에 한해 제공됩니다)
주요 수입국
주요 수출국
지속가능성과 환경 측면
지속가능한 실천
폐기물 감축 전략
생산 에너지 효율
친환경 대처
탄소발자국 고려
제4장 경쟁 구도
서론
기업의 시장 점유율 분석
지역별
북미
유럽
아시아태평양
라틴아메리카
중동 및 아프리카
기업 매트릭스 분석
주요 시장 기업의 경쟁 분석
경쟁 포지셔닝 매트릭스
주요 발전
인수합병(M&A)
파트너십 및 협업
신제품 발매
확장 계획
제5장 시장 추산·예측 : 제품 유형별, 2021년-2034년
주요 동향
액체 수축 억제제
분말 수축 저감제
기타
제6장 시장 추산·예측 : 화학 복합재료별, 2021년-2034년
주요 동향
폴리 에테르
다가 알코올
글리콜 및 글리콜 에테르
계면활성제
기타
제7장 시장 추산·예측 : 용도별, 2021년-2034년
주요 동향
생콘크리트
프리캐스트 콘크리트
자기 충전 콘크리트
고성능 콘크리트
숏크리트
모르타르 및 그라우트
기타
제8장 시장 추산·예측 : 최종 이용 산업별, 2021년-2034년
주요 동향
주택 건설
상업 건설
인프라 개발
산업 건설
물 차단 구조물
기타
제9장 시장 추산·예측 : 지역별, 2021년-2034년
주요 동향
북미
미국
캐나다
유럽
독일
영국
프랑스
스페인
이탈리아
기타 유럽
아시아태평양
중국
인도
일본
호주
한국
기타 아시아태평양
라틴아메리카
브라질
멕시코
기타 라틴아메리카
중동 및 아프리카
사우디아라비아
남아프리카공화국
아랍에미리트(UAE)
기타 중동 및 아프리카
제10장 기업 개요
BASF SE
Cementaid International Group
Cemex S.A.B. de C.V.
Euclid Chemical Company
Fosroc International Ltd.
GCP Applied Technologies(now part of Saint-Gobain)
Imerys S.A.
Mapei S.p.A.
Nippon Shokubai Co., Ltd.
RPM International Inc.
Sika AG
Sobute New Material Co., Ltd.
W. R. Grace &Co.(now part of Standard Industries)
LSH
영문 목차
영문목차
The Global Material Shrinkage-Reducing Agents Market was valued at USD 1.5 billion in 2024 and is estimated to grow at a CAGR of 5.8% to reach USD 2.6 billion by 2034. As construction standards evolve to prioritize structural resilience and long-term performance, shrinkage-reducing agents (SRAs) have transitioned from simple additives to essential components in high-performance concrete mixes. These chemical solutions play a critical role in minimizing shrinkage-related cracks, preserving concrete strength, and enhancing durability. Previously, shrinkage concerns were managed by altering mix ratios, but today's demand for advanced materials in infrastructure and residential construction is fueling SRA adoption across global markets.
This growth is especially prominent in the Asia-Pacific region, driven by rapid industrialization and urban development. Rising emphasis on sustainability and the shift toward next-generation admixtures are accelerating the use of SRAs, particularly in large-scale projects where crack prevention is essential to lower long-term maintenance costs. As concrete applications continue to diversify across tunnels, high-rise structures, and modular designs, SRAs are increasingly seen as key to extending structural life while maintaining performance under environmental stress and load.
Market Scope
Start Year
2024
Forecast Year
2025-2034
Start Value
$1.5 Billion
Forecast Value
$2.6 Billion
CAGR
5.8%
The liquid SRAs segment made up 64.3% share in 2024, showing strong momentum due to their ease of integration with concrete mixtures. Their effective dispersion and compatibility with ready-mix applications make them a top choice in infrastructure and high-volume residential construction. These agents ensure consistent shrinkage mitigation and are widely adopted in both on-site and factory settings, including commercial real estate and public sector works.
Ready-mix concrete contributed 41% to the total market in 2024, standing out as a major consumer of SRAs. These agents are essential in reducing the risk of surface cracks and internal stress during the curing process, especially in ready-mix systems used in urban housing and commercial developments. In the precast concrete segment, SRAs have become crucial for maintaining dimensional accuracy and preventing assembly misalignments, which can arise due to material contraction.
U.S. Material Shrinkage-Reducing Agents Market held an 85% share, valued at USD 159.4 million. Its leadership position stems from robust infrastructure activity and increased focus on sustainable construction practices. Government-led investments in rehabilitating public assets such as bridges, government complexes, and transport infrastructure continue to drive demand for durable, crack-resistant concrete. This has led to the widespread adoption of SRAs among contractors seeking to extend the lifecycle of concrete structures while minimizing repair and upkeep costs. The country's commitment to eco-conscious building practices has also accelerated the shift toward advanced admixture technologies.
Prominent companies operating in the Material Shrinkage-Reducing Agents Market include BASF SE, Mapei S.p.A., GCP Applied Technologies (Saint-Gobain), Fosroc International Ltd., and Sika AG. Companies in the material shrinkage-reducing agents market are leveraging innovation, regional expansion, and sustainability to secure their market positions. Leading firms are focusing on developing eco-friendly SRAs that comply with green building certifications and enhance structural durability. Strategic alliances with construction firms and infrastructure developers allow these companies to embed their products directly into long-term projects. R&D investments are targeted toward improving formulation efficiency and performance under varied environmental conditions. Many players are also expanding production capacities in high-growth regions like Asia-Pacific to meet rising urban construction demand.
Table of Contents
Chapter 1 Methodology & Scope
1.1 Market scope and definition
1.2 Research design
1.2.1 Research approach
1.2.2 Data collection methods
1.3 Data mining sources
1.3.1 Global
1.3.2 Regional/Country
1.4 Base estimates and calculations
1.4.1 Base year calculation
1.4.2 Key trends for market estimation
1.5 Primary research and validation
1.5.1 Primary sources
1.6 Forecast model
1.7 Research assumptions and limitations
Chapter 2 Executive Summary
2.1 Industry 3600 synopsis
2.2 Key market trends
2.2.1 Regional
2.2.2 Product Type
2.2.3 Chemical Composites
2.2.4 Application
2.2.5 End use Industry
2.3 TAM Analysis, 2025-2034
2.4 CXO perspectives: Strategic imperatives
2.4.1 Executive decision points
2.4.2 Critical success factors
2.5 Future Outlook and Strategic Recommendations
Chapter 3 Industry Insights
3.1 Industry ecosystem analysis
3.1.1 Supplier Landscape
3.1.2 Profit Margin
3.1.3 Value addition at each stage
3.1.4 Factor affecting the value chain
3.1.5 Disruptions
3.2 Industry impact forces
3.2.1 Growth drivers
3.2.1.1 Growing demand for high-performance concrete
3.2.1.2 Increasing infrastructure development projects
3.2.1.3 Rising focus on durability and crack prevention
3.2.1.4 Technological advancements in admixture formulations
3.2.2 Industry pitfalls and challenges
3.2.2.1 Raw material price fluctuations
3.2.2.2 Stringent regulatory requirements
3.2.2.3 Technical expertise requirements
3.2.2.4 Competition from alternative shrinkage control methods
3.2.3 Market opportunities
3.2.3.1 Development of eco-friendly shrinkage-reducing agents
3.2.3.2 Expansion in emerging markets
3.2.3.3 Integration with smart concrete technologies
3.2.3.4 Application in specialized construction segments
3.3 Growth potential analysis
3.4 Regulatory landscape
3.4.1 North America
3.4.2 Europe
3.4.3 Asia Pacific
3.4.4 Latin America
3.4.5 Middle East & Africa
3.5 Porter's analysis
3.6 PESTEL analysis
3.6.1 Technology and Innovation landscape
3.6.2 Current technological trends
3.6.3 Emerging technologies
3.7 Price trends
3.7.1 By region
3.7.2 By product
3.8 Future market trends
3.9 Technology and Innovation landscape
3.9.1 Current technological trends
3.9.2 Emerging technologies
3.10 Patent Landscape
3.11 Trade statistics (HS code) (Note: the trade statistics will be provided for key countries only)
3.11.1 Major importing countries
3.11.2 Major exporting countries
3.12 Sustainability and Environmental Aspects
3.12.1 Sustainable Practices
3.12.2 Waste Reduction Strategies
3.12.3 Energy Efficiency in Production
3.12.4 Eco-friendly Initiatives
3.13 Carbon Footprint Considerations
Chapter 4 Competitive Landscape, 2024
4.1 Introduction
4.2 Company market share analysis
4.2.1 By region
4.2.1.1 North America
4.2.1.2 Europe
4.2.1.3 Asia Pacific
4.2.1.4 LATAM
4.2.1.5 MEA
4.3 Company matrix analysis
4.4 Competitive analysis of major market players
4.5 Competitive positioning matrix
4.6 Key developments
4.6.1 Mergers & acquisitions
4.6.2 Partnerships & collaborations
4.6.3 New Product Launches
4.6.4 Expansion Plans
Chapter 5 Market Estimates and Forecast, By Product Type, 2021 - 2034 (USD Billion) (Kilo Tons)
5.1 Key trends
5.2 Liquid shrinkage-reducing agents
5.3 Powder shrinkage-reducing agents
5.4 Others
Chapter 6 Market Estimates and Forecast, By Chemical Composites, 2021 - 2034 (USD Billion) (Kilo Tons)
6.1 Key trends
6.2 Polyethers
6.3 Polyalcohols
6.4 Glycols and glycol ethers
6.5 Surfactants
6.6 Others
Chapter 7 Market Estimates and Forecast, By Application, 2021 - 2034 (USD Billion) (Kilo Tons)
7.1 Key trends
7.2 Ready-mix concrete
7.3 Precast concrete
7.4 Self-consolidating concrete
7.5 High-performance concrete
7.6 Shotcrete
7.7 Mortars and grouts
7.8 Others
Chapter 8 Market Estimates and Forecast, By End Use Industry, 2021 - 2034 (USD Billion) (Kilo Tons)
8.1 Key trends
8.2 Residential construction
8.3 Commercial construction
8.4 Infrastructure development
8.5 Industrial construction
8.6 Water containment structures
8.7 Others
Chapter 9 Market Estimates and Forecast, By Region, 2021 - 2034 (USD Billion) (Kilo Tons)
9.1 Key trends
9.2 North America
9.2.1 U.S.
9.2.2 Canada
9.3 Europe
9.3.1 Germany
9.3.2 UK
9.3.3 France
9.3.4 Spain
9.3.5 Italy
9.3.6 Rest of Europe
9.4 Asia Pacific
9.4.1 China
9.4.2 India
9.4.3 Japan
9.4.4 Australia
9.4.5 South Korea
9.4.6 Rest of Asia Pacific
9.5 Latin America
9.5.1 Brazil
9.5.2 Mexico
9.5.3 Rest of Latin America
9.6 Middle East and Africa
9.6.1 Saudi Arabia
9.6.2 South Africa
9.6.3 UAE
9.6.4 Rest of Middle East and Africa
Chapter 10 Company Profiles
10.1 BASF SE
10.2 Cementaid International Group
10.3 Cemex S.A.B. de C.V.
10.4 Euclid Chemical Company
10.5 Fosroc International Ltd.
10.6 GCP Applied Technologies (now part of Saint-Gobain)
10.7 Imerys S.A.
10.8 Mapei S.p.A.
10.9 Nippon Shokubai Co., Ltd.
10.10 RPM International Inc.
10.11 Sika AG
10.12 Sobute New Material Co., Ltd.
10.13 W. R. Grace & Co. (now part of Standard Industries)