


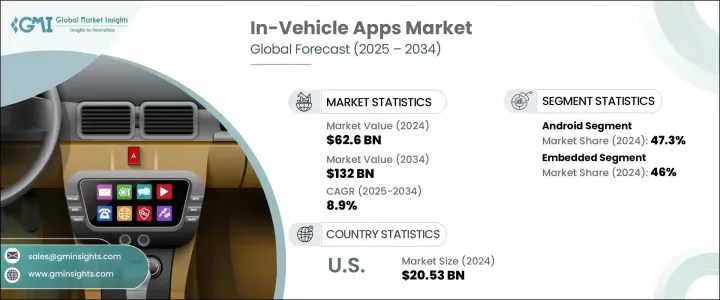
세계의 차량 내 앱 시장 규모는 2024년에 626억 달러로 평가되었고, 자동차 기술의 급속한 진보와 전기자동차나 자율 주행차의 보급 증가에 의해 CAGR 8.9%로 성장하여 2034년에는 1,320억 달러에 달할 것으로 예측되고 있습니다.
이 차세대 차량들은 내비게이션, 에너지 효율성, 운전 보조 기능 등을 관리하기 위해 소프트웨어 생태계에 점점 더 의존하고 있습니다. 이에 따라 차량 내 애플리케이션은 사용자 경험 향상, 기능 개선, 지속적인 연결성 제공을 목표로 하는 자동차 제조사들에게 필수적인 요소로 부상하고 있습니다. 스마트 모빌리티 솔루션에 대한 강조와 차량 내 실시간 서비스 통합은 운전자가 차량과 상호작용하는 방식을 변화시키고 있으며, 편의성, 안전성, 개인화를 중시하는 앱 중심 경험을 촉진하고 있습니다.

자동차 제조사들은 HD 터치스크린, AI 기반 음성 제어, 고속 연결을 지원하는 더 스마트한 인포테인먼트 플랫폼에 투자하고 있습니다. 향상된 운영 체제와 기기 간 원활한 동기화를 통해 이러한 플랫폼은 내비게이션, 미디어 액세스, 진단, 차량 제어 기능을 사용자 친화적인 인터페이스 내에서 제공하는 기능이 풍부한 앱을 구동합니다. 소비자들이 스마트폰과 태블릿에서 경험하는 것과 같은 유연한 디지털 경험을 차량 내에서도 기대함에 따라 이러한 솔루션에 대한 수요가 증가하고 있습니다.
| 시장 범위 | |
|---|---|
| 시작 연도 | 2024년 |
| 예측 연도 | 2025-2034년 |
| 시작 금액 | 626억 달러 |
| 예측 금액 | 1,320억 달러 |
| CAGR | 8.9% |
안드로이드 기반 차량용 플랫폼 부문은 2024년 47.3%의 시장 점유율을 차지했으며, 이 부문은 2034년까지 9.5%의 연평균 성장률로 성장할 것으로 예상됩니다. 안드로이드의 오픈소스 유연성이 매력으로 작용합니다. 이 유연성은 자동차 제조사들이 맞춤형 및 확장 가능한 인포테인먼트 생태계를 구축할 수 있도록 합니다. 이 접근 방식은 다양한 제3자 서비스 및 애플리케이션과의 통합을 지원하며, 운전자가 내비게이션, 음악, 음성 보조 기능, 실시간 차량 데이터를 다양한 가격대 및 모델에서 이용할 수 있도록 합니다. 자동차 제조사들은 진화하는 소비자 요구에 맞는 몰입형 및 개인화된 경험을 제공하기 위해 안드로이드를 점점 더 선호하고 있습니다.
커넥티비티 기술별로 분류하면 내장형 시스템 부문은 2024년 46%의 시장 점유율을 차지했습니다. 이 내장형 애플리케이션은 외부 스마트폰이나 모바일 기기와 독립적으로 작동하며, 모든 운전 조건에서 높은 신뢰성을 제공합니다. 차량의 하드웨어와 내부 네트워크에 직접 통합되어 안전 경고, 경로 안내, 시스템 진단 등 핵심 기능에 일관된 접근을 제공하며, 인터넷 연결이 제한적이거나 없는 지역에서도 작동합니다.
미국의 차량 내 앱 시장은 2024년 85.6%의 점유율을 차지하며 205억 3,000만 달러를 창출했습니다. 이는 미국의 성숙한 자동차 산업, 고도화된 인프라, 연결형 차량 기능에 대한 수요가 혁신과 채택을 촉진하고 있기 때문입니다. 주요 자동차 OEM, 기술 기업, 소프트웨어 개발사의 강력한 존재는 제품 개발 및 배포를 위한 협업 환경을 조성합니다. 미국 시장은 고급 인포테인먼트, 스마트폰과의 원활한 통합, 차량 내 실시간 디지털 서비스에 대한 소비자의 높은 기대감으로부터 혜택을 받고 있습니다.
글로벌 차량 내 앱 시장 주요 업체인 현대자동차, 애플, 마이크로소프트, 하만 인터내셔널 인더스트리스, 엔비디아, 가민, 토요타 모터, NXP 반도체, 제너럴 모터스, 구글 등은 시장 지위를 강화하기 위해 여러 핵심 전략에 집중하고 있습니다. 이 전략에는 OEM과의 파트너십, AI 및 클라우드 서비스 통합, 사용자 경험을 향상시키기 위한 독자적인 운영 체제 개발이 포함됩니다. 기업들은 또한 앱 생태계를 확장하고 사용자 인터페이스 디자인에 투자하며, 모빌리티 스타트업과의 협력을 통해 경쟁이 치열한 환경에서 트렌드를 선도하고 차별화된 확장 가능한 솔루션을 제공하기 위해 노력하고 있습니다.
The Global In-Vehicle Apps Market was valued at USD 62.6 billion in 2024 and is estimated to grow at a CAGR of 8.9% to reach USD 132 billion by 2034, driven by the rapid advancements in automotive technology, coupled with the rising adoption of electric and autonomous vehicles. These next-gen vehicles are increasingly reliant on software ecosystems to manage navigation, energy efficiency, driver assistance, and more. As a result, in-vehicle applications are becoming indispensable for automakers looking to enhance user experience, improve functionality, and offer continuous connectivity. The growing emphasis on smart mobility solutions and the integration of real-time services into vehicles is transforming how drivers interact with their cars, promoting app-centric experiences that prioritize convenience, safety, and personalization.
Automakers are investing in smarter infotainment platforms that support HD touchscreens, AI-powered voice controls, and high-speed connectivity to elevate in-car interactions. With enhanced operating systems and seamless synchronization across devices, these platforms are powering feature-rich apps that offer navigation, media access, diagnostics, and vehicle control within a user-friendly interface. The demand for these solutions is increasing as consumers expect the same fluid digital experience inside their cars that they get from their smartphones and tablets.
| Market Scope | |
|---|---|
| Start Year | 2024 |
| Forecast Year | 2025-2034 |
| Start Value | $62.6 Billion |
| Forecast Value | $132 Billion |
| CAGR | 8.9% |
The Android-based in-vehicle platforms segment held a 47.3% share in 2024, and this segment is expected to grow at a CAGR of 9.5% through 2034. The appeal lies in Android's open-source flexibility, which allows car manufacturers to build customizable and scalable infotainment ecosystems. This approach supports integration with a broad range of third-party services and applications, enabling drivers to access navigation, music, voice assistants, and real-time vehicle data across various price segments and models. Automakers are increasingly leaning toward Android to craft immersive, personalized experiences that match evolving consumer demands.
When categorized by connectivity technology, the embedded systems segment held a 46% share in 2024. These built-in applications function independently of external smartphones or mobile devices, which makes them highly reliable in all driving conditions. By integrating directly with the vehicle's hardware and internal network, embedded apps offer consistent access to core features like safety alerts, route guidance, and system diagnostics-even in areas with limited or no internet connectivity.
United States In-Vehicle Apps Market held 85.6% share and generated USD 20.53 billion in 2024 as the country's mature auto industry, high-tech infrastructure, and demand for connected vehicle features continue to propel innovation and adoption. The strong presence of leading automotive OEMs, tech companies, and software developers fosters a collaborative environment for rapid product development and deployment. The U.S. market benefits from high consumer expectations for advanced infotainment, seamless smartphone integration, and real-time digital services in vehicles.
Leading players in the Global In-Vehicle Apps Market, including Hyundai Motor Company, Apple, Microsoft, Harman International Industries, Nvidia, Garmin, Toyota Motor, NXP Semiconductors, General Motors, and Google, are focused on several key strategies to reinforce their market foothold. These include partnerships with OEMs, integration of AI and cloud services, and development of proprietary operating systems to enhance user experience. Companies are also expanding their app ecosystems, investing in user interface design, and collaborating with mobility startups to stay ahead of trends and offer differentiated, scalable solutions in a highly competitive environment.