


세계의 담수화 및 정화 장비 시장은 2024년 359억 달러로 평가되었고, 2034년 778억 달러에 이를 것으로 추정되며, CAGR 8.3%로 성장할 전망입니다.
이러한 성장은 특히 건조 및 반건조 지역의 인구 밀도 증가와 급속한 도시 확장으로 인해 담수 공급에 대한 압력이 증가하고 있기 때문입니다. 강과 지하 대수층과 같은 전통적인 수원이 고갈, 오염, 기후 변화로 인한 불안정성 증가에 직면하면서 담수 생산을 위한 대체 기술이 주목받고 있습니다. 그중에서도 담수화는 특히 식염수와 기수를 깨끗한 식수로 전환할 수 있다는 점에서 신뢰할 수 있는 대안으로 주목받고 있습니다. 역삼투압 및 전기 투석과 같은 공정의 기술적 개선으로 운영 비용과 에너지 소비가 크게 감소하여 대규모 배포에 더욱 매력적입니다. 농업, 산업 활동, 도시 개발 전반에 걸쳐 물이 중요한 자원이 되면서 일관되고 지속 가능한 물 솔루션에 대한 수요로 인해 다양한 분야에서 첨단 담수화 및 정화 시스템이 채택되고 있습니다.

이 시장에서 가장 빠르게 성장하는 분야 중 하나는 자외선(UV) 정화입니다. UV 시스템은 독성 화학 부산물을 생성하지 않고 물속의 유해 미생물을 제거할 수 있는 능력으로 인해 산업 전반에 걸쳐 탄력을 받고 있습니다. 환경 지속 가능성이 글로벌 정책과 산업 운영의 중심이 되면서, 낮은 에너지 요구량, 최소한의 유지보수 필요성, 장기적인 비용 효율성 덕분에 UV 정화가 선호되고 있습니다. 또한 이러한 시스템은 새로 개발되거나 기존의 수처리 프레임워크에 쉽게 통합할 수 있어 도시와 농촌 모두에서 사용하기에 매력적입니다. UV 램프 기술의 발전으로 시스템 내구성과 성능이 향상되어 전 세계적으로 더 많은 채택이 이루어지고 있습니다. 안전한 식수에 대한 접근성이 전 세계적으로 여전히 시급한 문제로 대두됨에 따라 자외선 정화는 공공 및 개인 용수 확보에 있어 중요한 요소로 인식되고 있습니다.
| 시장 범위 | |
|---|---|
| 시작 연도 | 2024년 |
| 예측 연도 | 2025-2034년 |
| 시작 금액 | 359억 달러 |
| 예측 금액 | 778억 달러 |
| CAGR | 8.3% |
유통 채널은 이 장비가 최종 사용자에게 도달하는 방식에서 중요한 역할을 합니다. 2024년에는 간접 유통 채널이 전체 점유율의 50.12%를 차지하며 시장을 지배했으며 2034년에는 376억 달러의 가치에 도달할 것으로 예상됩니다. 이 경로는 모든 시장에 물리적 입지를 구축하지 않고도 지리적 입지를 확장하려는 제조업체에게 유리한 것으로 입증되었습니다. 리셀러, 에이전트 및 타사 유통업체와의 파트너십을 통해 기업은 현지 시장 지식, 규제에 대한 친숙함, 기존 고객 네트워크를 활용할 수 있습니다. 이러한 접근 방식은 새로운 시장에 제품을 출시하는 데 필요한 시간을 크게 단축하는 동시에 물류 및 운영 효율성을 최적화합니다. 따라서 간접 유통은 다양한 지역에 걸쳐 도달 범위와 대응력을 모두 향상시키는 전략적 도구가 되었습니다.
운영 방식에 있어서는 자동 시스템이 시장을 주도하고 있습니다. 2024년에는 자동 시스템이 전체 시장 점유율의 54.8%를 차지할 것으로 예상됩니다. 이러한 시스템을 통해 화학물질 주입량, 압력 수준, 유량과 같은 중요한 운영 매개변수를 실시간으로 모니터링하고 자동으로 제어할 수 있습니다. 자동 시스템의 초기 비용은 일반적으로 수동 시스템보다 높지만, 노동 의존도 감소, 유지보수 감소, 에너지 효율성 향상 등 장기적인 이점으로 인해 대규모 또는 원격 시설에서 더 유용하게 사용할 수 있습니다. 또한 IoT 및 원격 모니터링 기술과의 통합으로 운영 안정성이 향상되고 분산된 인프라를 중앙 집중식으로 관리할 수 있어 대규모 담수화 플랜트에 필수적인 요소입니다.
지역적으로 미국은 2024년 북미 시장에서 84.30%의 압도적인 점유율을 차지했으며, 예측 기간 동안 8.9%의 연평균 성장률로 계속 확장할 것으로 예상됩니다. 특히 가뭄과 물 부족의 영향을 받는 지역에서 고급 수처리 솔루션에 대한 높은 수요에 힘입어 미국이 우위를 점하고 있습니다. 국내외 유수의 기업들이 지속 가능한 물 사용을 지원하는 혁신적인 시스템을 제공하는 데 적극적으로 참여하고 있습니다. 이러한 기업들은 R&D에 많은 투자를 하고 있으며, 설계부터 유지보수까지 종합적인 서비스를 제공하며 대규모 산업 및 지자체 프로젝트의 신뢰할 수 있는 파트너로 자리매김하고 있습니다.
시장의 주요 기업인 북미 베오리아, 아쿠아텍 인터내셔널, 수에즈 워터 테크놀로지스 & 솔루션즈, 자일렘, IDE 테크놀로지스의 5개사는 총 세계 매출의 약 40%에서 50%를 차지하고 있습니다. 이 회사들은 역삼투압, UV 시스템, 멤브레인 여과와 같은 최첨단 기술과 풀서비스 솔루션을 전 세계 고객 기반에 제공합니다. 에너지 효율성, 친환경 관행, 공공 및 민간 부문 기관과의 전략적 협력에 중점을 두어 진화하는 물 담수화 및 정화 분야에서 리더십을 더욱 강화하고 있습니다.
The Global Water Desalination and Purification Equipment Market was valued at USD 35.9 billion in 2024 and is estimated to grow at a CAGR of 8.3% to reach USD 77.8 billion by 2034. This growth is largely attributed to the rising pressure on freshwater supplies due to increasing population density and rapid urban expansion, especially in dry and semi-arid regions. As conventional water sources-such as rivers and underground aquifers-face depletion, pollution, and growing instability due to climate variability, alternative technologies for freshwater production are gaining traction. Among them, desalination stands out as a reliable option, particularly because it enables the transformation of saline and brackish water into clean drinking water. Technological improvements in processes like reverse osmosis and electrodialysis have significantly reduced operational costs and energy consumption, making them more attractive for large-scale deployment. With water being a critical resource across agriculture, industrial activities, and urban development, the demand for consistent and sustainable water solutions is driving the adoption of advanced desalination and purification systems across various sectors.
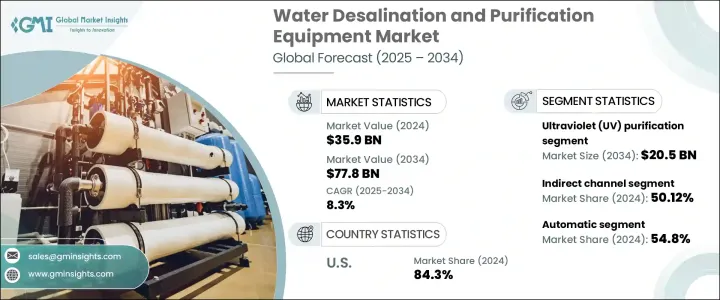
One of the fastest-growing segments in this market is ultraviolet (UV) purification. In 2024, the UV purification segment generated revenue of USD 8.8 billion and is anticipated to reach USD 20.5 billion by 2034. UV systems are gaining momentum across industries due to their ability to eliminate harmful microorganisms in water without producing toxic chemical by-products. As environmental sustainability becomes more central to global policy and industrial operations, UV purification is becoming a preferred choice thanks to its low energy requirements, minimal maintenance needs, and long-term cost-effectiveness. These systems are also adaptable and easy to integrate into both newly developed and pre-existing water treatment frameworks, increasing their appeal for use in both urban and rural applications. Advancements in UV lamp technology are enhancing system durability and performance, prompting greater adoption worldwide. As access to safe drinking water remains a pressing global concern, UV purification is being recognized as a critical component in securing water for both public and private use.
| Market Scope | |
|---|---|
| Start Year | 2024 |
| Forecast Year | 2025-2034 |
| Start Value | $35.9 Billion |
| Forecast Value | $77.8 Billion |
| CAGR | 8.3% |
Distribution channels play a significant role in how this equipment reaches end users. In 2024, the indirect distribution channel dominated the market, accounting for 50.12% of the overall share, and is projected to reach a valuation of USD 37.6 billion by 2034. This route has proven advantageous for manufacturers seeking to expand their geographical footprint without establishing a physical presence in every market. Through partnerships with resellers, agents, and third-party distributors, companies can leverage local market knowledge, regulatory familiarity, and pre-existing customer networks. This approach significantly reduces the time needed to introduce products to new markets while optimizing logistical and operational efficiency. Indirect distribution has therefore become a strategic tool in enhancing both reach and responsiveness across diverse regions.
When it comes to the mode of operation, automatic systems are leading the market. In 2024, automatic systems are expected to hold 54.8% of the total market share. These systems allow for real-time monitoring and automated control of critical operational parameters such as chemical dosing, pressure levels, and flow rates. Although the upfront cost of automatic systems is typically higher than their manual counterparts, the long-term benefits-including lower labor dependence, reduced maintenance, and enhanced energy efficiency-make them more viable for larger or remote facilities. Furthermore, integration with IoT and remote monitoring technologies enhances operational reliability and allows centralized management of distributed infrastructure, which is crucial for large-scale desalination plants.
Regionally, the United States held a commanding 84.30% share of the North American market in 2024 and is expected to continue expanding at a CAGR of 8.9% during the forecast years. The country's dominance is driven by high demand for advanced water treatment solutions, particularly in regions affected by drought and water scarcity. Leading domestic and international companies are actively involved in delivering innovative systems that support sustainable water use. These companies are heavily invested in R&D, offering comprehensive services from design to maintenance, and have established themselves as reliable partners for large-scale industrial and municipal projects.
The top five market players-Veolia North America, Aquatech International, SUEZ Water Technologies & Solutions, Xylem Inc., and IDE Technologies-collectively control about 40% to 50% of global revenue. These firms offer full-service solutions and cutting-edge technologies like reverse osmosis, UV systems, and membrane filtration to a global customer base. Their strong emphasis on energy efficiency, eco-friendly practices, and strategic collaborations with public and private sector entities further reinforce their leadership in the evolving landscape of water desalination and purification.