


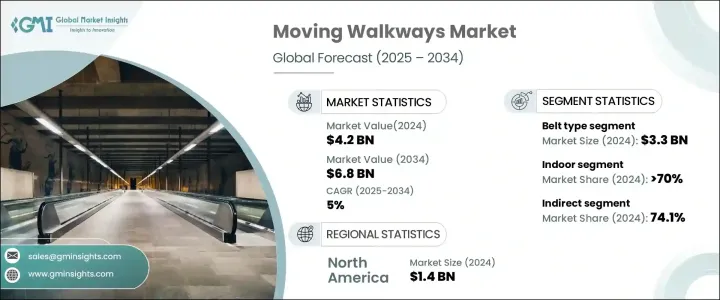
세계의 무빙워크 시장 규모는 2024년에 42억 달러로 평가되었고, CAGR 5%를 나타내, 2034년에는 68억 달러에 달할 것으로 예측되고 있습니다. 세계의 도시 경관이 진화를 이어가면서 도시계획자와 시장개척자가 스마트모빌리티 인프라를 우선하게 되었기 때문에 시장은 강한 기세를 보이고 있습니다. 대도시 지역에서는 인구 밀도가 높아지고 있으며, 효율적인 보행자 이동은 교통 생태계의 중요한 요소가 되고 있습니다. 무빙워크는 활기찬 공공 공간과 상업 공간에서 보행자 이동을 관리하는 합리적이고 자동화된 솔루션을 제공하여 인기를 끌고 있습니다. 대규모 공항과 지하철역에서 쇼핑몰과 전시 센터에 이르기까지 이러한 시스템은 보행 시간을 최소화하고 이동에 어려움을 겪는 사람들의 접근성을 향상시키고 교통량이 많은 지역의 혼잡을 완화하는 데 도움이 됩니다.

공공 인프라 프로젝트에 대한 투자 증가와 기존 교통 시스템의 근대화도 선진적인 무빙워크 시스템 수요에 박차를 가하고 있습니다. 지속 가능하고 효율적인 도시 이동성에 대한 강조로 인해 에너지 절약 드라이브, 지능형 센서, 실시간 모니터링과 같은 기능을 갖춘 무빙워크의 도입이 더욱 확대되고 있습니다. 안전, 편의성, 자동화에 대한 관심이 높아지면서 무빙워크는 신규 개발과 개조 공간 모두에서 선호되는 모빌리티 솔루션이 되고 있습니다. 또한 내구성과 낮은 유지보수, 향상된 사용자 경험에 기여하는 재료 및 설계 기술의 발전으로 무빙워크 시장은 혜택을 받고 있습니다.
| 시장 범위 | |
|---|---|
| 시작 연도 | 2024년 |
| 예측 연도 | 2025-2034년 |
| 시작 금액 | 42억 달러 |
| 예측 금액 | 68억 달러 |
| CAGR | 5% |
제품 유형별로는 벨트 유형의 무빙워크 부문이 2024년에 33억 달러의 수익을 올렸고, 2025년부터 2034년까지 연평균 복합 성장률(CAGR) 5.2%를 나타낼 것으로 예측됩니다. 이 보도는 보행자에게 부드럽고 안정적인 노면을 제공하는 평평한 연속 벨트를 특징으로 하며 유모차나 바퀴가 달린 짐, 이동 보조구를 사용하는 여행자에게 이상적입니다. 벨트식 시스템은 범용성이 높기 때문에 상업시설에서 교통량이 많은 대중교통터미널에 이르기까지 다양한 환경에 적합합니다.
설치에 관해서는 실내용 무빙워크가 2024년 세계 시장에서 70%의 점유율을 차지했고, 2034년까지 연평균 복합 성장률(CAGR) 5.3%를 나타낼 것으로 예측됩니다. 공항, 역, 복합 쇼핑 시설 등 실내 공간에서의 보행자의 흐름을 최적화하는 요구의 고조가 이 성장의 원동력이 되고 있습니다.
북미는 세계의 무빙워크 시장에서 33.5%의 점유율을 차지했으며, 2024년에는 14억 달러를 창출했습니다. 북미 외에도 유럽, 아시아태평양, 라틴아메리카, 중동 및 아프리카에서도 인프라의 근대화와 스마트 시티의 성장으로 급속한 도입이 진행되고 있습니다.
세계의 무빙워크 시장에서 주요 기업은 히타치 제작소, TK 엘리베이터, 오티스 엘리베이터 회사, 미쓰비시 전기 주식회사, Johnson Lifts Private Limited, 주식회사 도시바, Stannah, 후지텍 주식회사, KLEEMANN, KONE 주식회사, Sicher Elevator Co.Ltd. Elevator, Schindler, Delfar Elevator Co.Ltd.등이 있습니다. 이러한 기업은 연구개발에 대한 투자, 에너지 효율이 높은 솔루션의 제공, 인텔리전트 오토메이션의 통합에 의해 경쟁력을 높이고 있습니다.
The Global Moving Walkways Market was valued at USD 4.2 billion in 2024 and is estimated to grow at a CAGR of 5% to reach USD 6.8 billion by 2034. The market is witnessing strong momentum as urban landscapes worldwide continue to evolve, prompting city planners and developers to prioritize smart mobility infrastructure. With growing population densities in metropolitan areas, efficient pedestrian movement is becoming a critical component of transportation ecosystems. Moving walkways are gaining traction as they offer streamlined, automated solutions for managing foot traffic across busy public and commercial spaces. From large airports and metro stations to shopping malls and exhibition centers, these systems help minimize walking time, improve accessibility for people with mobility challenges, and reduce congestion in high-traffic zones.
Rising investments in public infrastructure projects and the modernization of existing transit systems are also fueling demand for advanced moving walkway systems. Governments and private developers are increasingly integrating automated pedestrian transport into their master plans, especially in the context of smart city initiatives. The emphasis on sustainable and efficient urban mobility is further amplifying the adoption of moving walkways equipped with features like energy-saving drives, intelligent sensors, and real-time monitoring. As the focus on safety, convenience, and automation deepens, moving walkways are becoming a preferred mobility solution in both new developments and retrofitted spaces. The market is also benefiting from advancements in materials and design technologies, which contribute to durability, low maintenance, and enhanced user experience.
| Market Scope | |
|---|---|
| Start Year | 2024 |
| Forecast Year | 2025-2034 |
| Start Value | $4.2 Billion |
| Forecast Value | $6.8 Billion |
| CAGR | 5% |
By product type, the belt-type moving walkways segment generated USD 3.3 billion in revenue in 2024 and is forecast to grow at a CAGR of 5.2% between 2025 and 2034. These walkways feature flat, continuous belts that offer a smooth and stable surface for pedestrians, making them ideal for travelers with strollers, wheeled luggage, or mobility aids. The design reduces tripping risks and enhances the overall safety of the walkway. The versatility of belt-type systems makes them suitable for diverse settings, ranging from commercial centers to high-traffic public transit terminals. Their growing popularity stems from their ability to blend seamlessly with modern architecture while providing a safer and more efficient transit experience.
When it comes to installation, indoor moving walkways dominated the global market in 2024, accounting for a 70% share, and are expected to grow at a 5.3% CAGR through 2034. The increasing need for pedestrian flow optimization in indoor spaces-such as airports, train stations, and shopping complexes-is driving this growth. The rising demand for connected, tech-driven infrastructure within enclosed environments is encouraging the integration of walkways to enhance crowd management and passenger convenience.
North America held a 33.5% share of the global moving walkways market, generating USD 1.4 billion in 2024. The region remains a key adopter due to continuous investments in public infrastructure, including large airports, urban transit systems, and commercial developments. In addition to North America, rapid adoption across Europe, Asia Pacific, Latin America, and the Middle East & Africa is being driven by infrastructure modernization and smart city growth.
Major players in the global moving walkways market include Hitachi LTD, TK Elevator, Otis Elevator Company, Mitsubishi Electric Corp, Johnson Lifts Private Limited, Toshiba Corporation, Stannah, Fujitec, KLEEMANN, KONE Corporation, Sicher Elevator Co., Ltd., Hyundai Elevator Company, Dazen Elevator, Schindler, and Delfar Elevator Co., Ltd. These companies are enhancing their competitive edge by investing in R&D, offering energy-efficient solutions, and integrating intelligent automation. Collaborations with transit authorities and infrastructure developers are enabling deeper market penetration, while digital monitoring and improved after-sales services are helping operators boost performance and minimize downtime.