


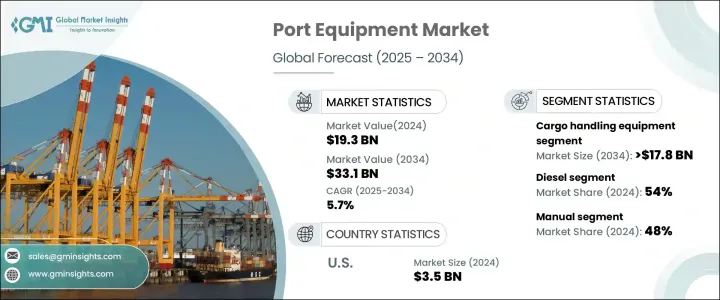
세계의 항만 설비 시장은 2024년에 193억 달러로 평가되었으며, 2025년부터 2034년까지 CAGR 5.7%를 나타낼 것으로 예측됩니다.
국제 무역과 컨테이너 화물 증가로 첨단 항만 인프라와 효율적인 화물 처리 시스템에 대한 수요가 높아지고 있습니다. 글로벌 공급망의 확장은 대형 선박을 수용하고 운영 효율성을 향상시킬 수 있는 최신 항만 장비에 대한 필요성이 증가하고 있습니다. 처리 시간을 단축하고 인력 개입을 줄이기 위해 자동화된 화물 처리 시스템, 인공지능, IoT 기반 물류 솔루션을 통합하고 있습니다.

실시간 모니터링, 안전 강화, 원활한 물류 관리 요구가 지속적으로 증가함에 따라 항만 자동화와 스마트 인프라 투자가 증가하고 있습니다. 특히 심해 터미널과 대용량 저장 시스템이 개발되고 있는 개발도상국에서 이러한 투자가 활발합니다. 항만 운영을 간소화하고 더 많은 화물을 효율적으로 관리하기 위해 갠트리 크레인, 쉽투쇼어 크레인, 무인운반차(AGV)에 대한 수요가 증가하고 있습니다.
| 시장 범위 | |
|---|---|
| 시작 연도 | 2024년 |
| 예측 연도 | 2025-2034년 |
| 시작 금액 | 193억 달러 |
| 예측 금액 | 331억 달러 |
| CAGR | 5.7% |
시장은 장비 유형, 추진, 운영에 의해 구분됩니다. 하역 장비는 시장 점유율의 45% 이상을 차지하며 2034년까지 178억 달러를 초과할 것으로 예측됩니다. 효율적인 화물 취급 장비는 항만의 정박 시간을 단축하고 선박 회전율을 극대화하는 데 도움이 됩니다.
추진 유형별로 시장은 디젤, 전기, 하이브리드로 구분됩니다. 디젤 동력 항만 장비는 2024년 시장 점유율 54%를 차지했습니다. 리치 스태커, 스트래들 캐리어, 고무 타이어 갠트리 크레인은 높은 토크와 하중 처리 성능으로 인해 주로 디젤 엔진에 의존하고 있습니다. 대안은 전동화가 주목받고 있는 한편, 배터리 구동 시스템으로의 이행은 고비용, 한정된 리프팅 능력, 충전 시간의 연장 등의 과제에 직면하고 있습니다. 디젤 연료가 이용 가능하고, 급유 인프라가 확립되어 있는 것이 디젤 연료의 우위를 더욱 뒷받침하고 있습니다. 많은 항만, 특히 신흥 경제 국가에서는 LNG 및 수소와 같은 대체 연료 솔루션을 아직 도입하지 않아 디젤 장비가 여전히 선두를 유지하고 있습니다.
시장은 운영 방식에 따라 수동, 반자동, 완전 자동화 부문으로 구분됩니다. 수동 항만 장비는 2024년 시장 점유율 48%를 기록했습니다. 지게차, 이동식 크레인 및 수동 리치 스태커는 초기 투자 및 유지 보수 비용이 낮기 때문에 특히 중소규모의 항구에서 여전히 널리 사용되고 있습니다. 자동화된 시스템과는 달리, 수동 장비는 불규칙한 모양의 화물 및 브레이크 벌크 화물을 포함한 다양한 유형의 화물을 취급할 때 더 높은 유연성을 제공합니다. 개발 도상 지역은 자동화보다 무역 인프라 확충을 우선하기 때문에 수동 항만 장비에 대한 수요가 지속적으로 증가하고 있습니다.
북미는 세계 시장을 선도하고 있으며 미국은 2024년에 35억 달러 매출을 창출했습니다. 이 지역에서는 항구의 현대화와 첨단 하역 시스템에 대한 투자가 계속되고 있으며 시장 성장을 가속하고 있습니다.
The Global Port Equipment Market was valued at USD 19.3 billion in 2024 and is projected to grow at a CAGR of 5.7% from 2025 to 2034. Increasing international trade and containerized cargo are driving demand for advanced port infrastructure and efficient cargo handling systems. The expansion of global supply chains has heightened the need for modern port equipment that can accommodate larger vessels and improve operational efficiency. To enhance turnaround times and reduce human intervention, ports are integrating automated cargo handling systems, artificial intelligence, and IoT-based logistics solutions.
Investments in port automation and smart infrastructure are increasing as the need for real-time monitoring, enhanced safety, and seamless logistics management continues to rise. Both government and private sectors are allocating substantial resources to upgrade ports, particularly in developing regions, where deep-water terminals and high-capacity storage systems are being developed. Demand for gantry cranes, ship-to-shore cranes, and automated guided vehicles is rising as ports aim to streamline operations and manage higher cargo volumes efficiently.
| Market Scope | |
|---|---|
| Start Year | 2024 |
| Forecast Year | 2025-2034 |
| Start Value | $19.3 Billion |
| Forecast Value | $33.1 Billion |
| CAGR | 5.7% |
The market is segmented by equipment type, propulsion, and operation. Cargo handling equipment held over 45% of the market share and is projected to surpass USD 17.8 billion by 2034. The rapid growth of containerized cargo has increased the need for ship-to-shore cranes, rubber-tired gantry cranes, straddle carriers, and reach stackers. Efficient cargo handling equipment helps ports reduce berth occupation times and maximize ship turnaround rates. Automated solutions such as automatic stacking cranes and terminal tractors are gaining traction, improving productivity and minimizing delays.
By propulsion type, the market is categorized into diesel, electric, and hybrid. Diesel-powered port equipment accounted for 54% of the market share in 2024. Reach stackers, straddle carriers, and rubber-tired gantry cranes primarily rely on diesel engines due to their high torque and load-handling capabilities. Diesel-powered equipment remains the preferred choice for ports handling bulk materials and heavy cargo, as it ensures uninterrupted operations. While electrification is gaining attention, the transition to battery-powered systems faces challenges, including high costs, limited lifting capacity, and extended charging times. The availability of diesel fuel and well-established fueling infrastructure further supports its dominance. Many ports, particularly in developing economies, have yet to implement alternative fueling solutions such as LNG and hydrogen, keeping diesel equipment at the forefront.
Based on operation, the market is divided into manual, semi-automated, and fully automated segments. Manual port equipment held a 48% market share in 2024. Forklifts, mobile cranes, and manually operated reach stackers remain widely used, especially in small and medium-sized ports, due to lower initial investment and maintenance costs. Unlike automated systems, manual equipment offers greater flexibility in handling diverse cargo types, including irregularly shaped goods and breakbulk shipments. Developing regions prioritize trade infrastructure expansion over automation, leading to sustained demand for manual port equipment.
North America leads the global market, with the United States generating USD 3.5 billion in 2024. The region's ongoing investments in port modernization and advanced cargo handling systems continue to fuel market growth.