지능형 교통 시스템(ITS) 시장 기회, 성장 촉진 요인, 산업 동향 분석, 예측(2025-2034년)
Intelligent Transportation System (ITS) Market Opportunity, Growth Drivers, Industry Trend Analysis, and Forecast 2025-2034
상품코드:1698553
리서치사:Global Market Insights Inc.
발행일:2025년 02월
페이지 정보:영문 180 Pages
라이선스 & 가격 (부가세 별도)
ㅁ Add-on 가능: 고객의 요청에 따라 일정한 범위 내에서 Customization이 가능합니다. 자세한 사항은 문의해 주시기 바랍니다.
한글목차
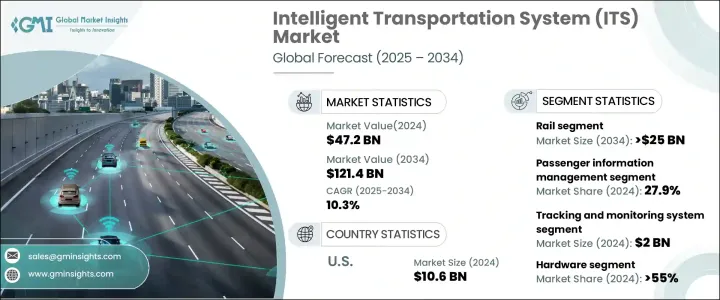
세계 지능형 교통 시스템(ITS) 시장은 2024년에 472억 달러로 평가되었으며, 2025년부터 2034년까지 연평균 복합 성장률(CAGR) 10.3%로 성장할 것으로 예측됩니다.
도시화가 전례 없는 속도로 진행되고 있는 동안, 스마트 시티 개발에 대한 주목이 높아지고 있는 것이 큰 추진력이 되고 있습니다.세계의 도시에서는 지속 가능하고 효율적이고 안전한 이동성 솔루션에 대비 수요가 증가하고 있습니다. 세계 인구가 도시로 이동하는 동안 교통 인프라의 디지털 기술의 발전은 교통 흐름을 최적화하고 교통 체증을 완화하며 대중 교통의 효율성을 향상시키는 데 필수적입니다.
ITS 솔루션은 고도의 교통 관리, 실시간 데이터 분석, 상호 연결성, 대중 교통 운행을 통합하고 도시의 이동성을 간소화합니다. 기술 도입이 진행됨에 따라 도시 확대로 수백만 대의 새로운 차량이 늘어날 것으로 예상되며 기존 교통 시스템에 과제가 생겨 지속가능성을 유지하기 위한 혁신적인 솔루션이 필요합니다. 석조 기술의 채택은 여러 교통 수단을 원활한 멀티 모달 네트워크에 통합하여 도시의 이동성을 재정의합니다. 효율성과 편의성이 향상됨에 따라 각 도시가 디지털 모빌리티 에코시스템을 추진하는 정책을 시행하는 동안 ITS에 대한 투자는 지속적으로 확대되고 보다 안전하고 지속 가능한 도시 교통 솔루션에 대한 수요가 증가하고 있습니다.
시장 범위
시작 연도
2024년
예측 연도
2025-2034년
시작 금액
472억 달러
예측 금액
1,214억 달러
CAGR
10.3%
시장은 철도, 도로, 항공, 선박 등 운송수단별로 구분됩니다. 임프라 업그레이드를 선도하고 도로 강화를 위한 고액 입찰을 실시했습니다.이 프로젝트는 교차로 개량, 도로 개수, 교통 관리 강화 및 정체 완화를 위한 실시간 모니터링 시스템 도입에 중점을 둡니다.
철도 분야에서는 스마트 티켓팅, 여객 정보 관리, 운행, 보안, 긴급 통지, 충돌 회피 등의 용도가 있습니다. 연평균 13%의 성장률로 성장할 것으로 예상됩니다. 교통기관에서의 디지털 변혁의 대처 강화는 실시간 통신 기술, 열차내 컴퓨팅 시스템, GPS 추적, 클라우드 기반의 정보 플랫폼을 활용하여 여객 체험과 업무 효율을 향상시키고 있습니다.
항공 운송 분야에는 정보 표시 시스템, 추적 및 감시 시스템, 셀프 서비스 수하물 솔루션, 키오스크 단말기, 통신 네트워크, 스마트 게이트 등이 포함됩니다. 선도적 인 GPS와 IoT 통합은 항공기, 승객 및 수하물의 실시간 추적을 가능하게하고 항공 업계에 혁명을 가져 왔습니다.
도로 교통시장은 하드웨어, 소프트웨어, 서비스로 분류됩니다.
북미에서는 미국이 2024년 매출액 106억 달러로 ITS 시장을 선도했습니다. 비접촉식 발권 시스템이 널리 도입되어 스마트폰, 스마트 카드, 디지털 월렛에 의한 원활한 운임 결제가 가능해지고 있습니다.
목차
제1장 조사 방법과 조사 범위
조사 디자인
조사 접근
데이터 수집 방법
기본 추정과 계산
기준연도의 산출
시장추계의 주요 동향
예측 모델
1차 조사와 검증
시장 범위와 정의
제2장 주요 요약
제3장 업계 인사이트
생태계 분석
원재료 공급자
부품 공급자
제조업체
기술/소프트웨어 공급자
시스템 통합자
서비스 제공업체
정부기관
금융 당국
공급자의 상황
이익률 분석
기술 혁신의 상황
특허 분석
주요 뉴스 및 이니셔티브
규제 상황
영향요인
성장 촉진요인
정부 출자와 PPP 모델
유럽과 북미에 있어서의 통근객의 종량제 승차권 서비스에 수요
북미 및 아시아태평양에서 효과적인 교통 관리를 위한 정부 이니셔티브의 상승
유럽의 철도 인프라 투자 확대
아시아태평양의 도시화의 급속한 진전과 스마트 시티 프로젝트 증가
업계의 잠재적 위험 및 과제
레거시 시스템과의 복잡한 통합
해사 기기의 고비용 높은 설치 비용과 데이터의 복잡성
성장 가능성 분석
Porter's Five Forces 분석
PESTEL 분석
제4장 경쟁 구도
소개
기업 점유율 분석
경쟁 포지셔닝 매트릭스
전략 전망 매트릭스
제5장 시장 추정 및 예측 : 수송 수단별, 2021년-2034년
주요 동향
철도
도로
항공
해양
제6장 시장 추정 및 예측 : 철도별, 2021년-2034년
주요 동향
컴포넌트
솔루션
철도 교통 관리
자산 관리 소프트웨어
철도 통신 및 네트워크
실시간 승객 정보 시스템
철도 분석
서비스
전문 서비스
설치, 보수, 운용
신청
스마트 티켓팅
승객 정보 시스템
운행 및 충돌 회피
보안
긴급 알림
기타
제7장 시장 추정 및 예측 : 도로별, 2021년-2034년
주요 동향
시스템
첨단 교통 관리 시스템(ATMS)
첨단 여행자 정보 시스템(ATIS)
첨단 교통요금 시스템(ATPS)
첨단 대중교통 시스템(APTS)
첨단 농촌교통 시스템(ARTS)
상용차 운행(CVO)
컴포넌트
하드웨어
통신 네트워크
인터페이스 보드
센서
모니터링 및 탐지 시스템
감시 카메라
소프트웨어
시각화 소프트웨어
영상 감지 관리 소프트웨어
통과 관리 시스템
기타
서비스
전문 서비스
설치, 보수, 운용
신청
교통관리
교통안전
화물 관리
주차장 관리
도로 사용료/ETC
텔레매틱스
제8장 시장 추정 및 예측 : 항공기별, 2021년-2034년
주요 동향
시스템
정보 표시 시스템
추적·감시 시스템
셀프서비스 수하물 시스템
키오스크 단말
통신 및 네트워크
스마트 게이트 시스템
기타
신청
보안
스마트 티켓
버스 추적
플릿 관리(항공기 관리)
긴급 알림
여객정보
기타
제9장 시장 추정 및 예측 : 해양별, 2021년-2034년
주요 동향
시스템
항해 정보 시스템
추적 및 감시 시스템
선박 교통 관리 시스템
신청
화물 수송(컨테이너)
보안 및 긴급신고
기상정보
해상 도착 및 운송
기타
제10장 시장 추정 및 예측 : 지역별, 2021년-2034년
북미
미국
캐나다
유럽
영국
독일
프랑스
스페인
이탈리아
네덜란드
러시아
아시아태평양
중국
인도
일본
싱가포르
호주
라틴아메리카
브라질
멕시코
아르헨티나
중동 및 아프리카
UAE
사우디아라비아
남아프리카
제11장 기업 프로파일
Alstom
Cisco
Clever Devices
Cubic
Embross
ETA Transit Systems
FURUNO ELECTRIC
Garmin
Indra Sistemas
Kapsch
Kongsberg Gruppen
Kyosan Electric Manufacturing
Lanner Electronics
Nisshinbo
Northrop Grumman
Q-Free ASA
Raytheon
Siemens
Teledyne
Thales
Trapeze Group
Xerox
SHW
영문 목차
영문목차
The Global Intelligent Transportation System Market reached a valuation of USD 47.2 billion in 2024 and is projected to expand at a CAGR of 10.3% from 2025 to 2034. The increasing focus on smart city development is a significant driver as urbanization continues to rise at an unprecedented rate. Cities worldwide are experiencing heightened demand for sustainable, efficient, and safer mobility solutions. As the global population shifts towards urban areas, digital advancements in transportation infrastructure are essential for optimizing traffic flow, reducing congestion, and improving public transit efficiency.
ITS solutions integrate advanced traffic management, real-time data analytics, interconnectivity, and public transit operations to streamline urban mobility. With growing environmental concerns, new technologies are being incorporated to support electric vehicles, shared transportation, and lower emissions. Urban expansion is expected to add millions of new vehicles to roads, challenging existing transport systems and requiring innovative solutions to maintain sustainability. The adoption of smart IoT, AI, and analytical technologies is redefining urban mobility by integrating multiple modes of transportation into seamless, multimodal networks. Real-time information systems allow travelers to access schedules, traffic updates, and alternate routes, enhancing efficiency and convenience. As cities implement policies promoting digital mobility ecosystems, investments in ITS continue to grow, driving the demand for safer and more sustainable urban transportation solutions.
Market Scope
Start Year
2024
Forecast Year
2025-2034
Start Value
$47.2 Billion
Forecast Value
$121.4 Billion
CAGR
10.3%
The market is segmented by mode of transportation, including rail, road, air, and marine. In 2024, the rail sector accounted for over 40% of the market share, while the road segment is forecast to exceed USD 25 billion by 2034. Governments are issuing high-value tenders for roadway enhancements, prioritizing infrastructure upgrades to accommodate increasing traffic volumes. These projects focus on improving intersections, rehabilitating roadways, and deploying real-time monitoring systems to enhance traffic management and mitigate congestion.
Within the railway segment, applications include smart ticketing, passenger information management, operations, security, emergency notifications, and collision avoidance. Passenger information management accounted for a 27.9% market share in 2024, while smart ticketing is projected to grow at a CAGR of 13% by 2034. Enhanced digital transformation efforts in transportation are leveraging real-time communication technologies, in-train computing systems, GPS tracking, and cloud-based information platforms to improve passenger experience and operational efficiency.
The air transportation segment includes information display systems, tracking and monitoring systems, self-service baggage solutions, kiosks, communication networks, and smart gates. Tracking and monitoring solutions led the market in 2024 with a valuation of USD 2 billion. The integration of GPS and IoT has revolutionized aviation by enabling real-time tracking of aircraft, passengers, and baggage. Enhanced situational awareness improves safety, operational efficiency, and asset management, ensuring seamless airline and airport operations.
The road transportation market is categorized into hardware, software, and services. In 2024, the hardware segment dominated, with a market share exceeding 55%. The adoption of GPS units, sensors, high-definition cameras, and ruggedized IoT devices has improved connectivity and operational reliability. Edge computing enables data processing within vehicles, enhancing efficiency and passenger safety.
In North America, the United States led the ITS market with a revenue of USD 10.6 billion in 2024. Public transit systems are increasingly adopting shared mobility services, integrating bike-sharing, e-scooters, and ride-sharing into multimodal transport networks. Contactless ticketing systems have been widely implemented, enabling seamless fare payments through smartphones, smart cards, and digital wallets. These advancements are enhancing urban mobility by reducing congestion, improving transit efficiency, and providing a more connected transportation experience.
Table of Contents
Chapter 1 Methodology & Scope
1.1 Research design
1.1.1 Research approach
1.1.2 Data collection methods
1.2 Base estimates & calculations
1.2.1 Base year calculation
1.2.2 Key trends for market estimation
1.3 Forecast model
1.4 Primary research and validation
1.4.1 Primary sources
1.4.2 Data mining sources
1.5 Market scope & definition
Chapter 2 Executive Summary
2.1 Industry synopsis, 2021 - 2034
Chapter 3 Industry Insights
3.1 Industry ecosystem analysis
3.1.1 Raw material suppliers
3.1.2 Component suppliers
3.1.3 Manufacturers
3.1.4 Technology/software providers
3.1.5 System integrators
3.1.6 Service providers
3.1.7 Government agencies
3.1.8 Financial authorities
3.2 Supplier landscape
3.3 Profit margin analysis
3.4 Technology & innovation landscape
3.5 Patent analysis
3.6 Key news & initiatives
3.7 Regulatory landscape
3.8 Impact forces
3.8.1 Growth drivers
3.8.1.1 Government funding and PPP models
3.8.1.2 Demand for Pay-as-you-go ticketing service among commuters in Europe and North America
3.8.1.3 Rise in favorable government initiatives for effective traffic management in North America and Asia Pacific
3.8.1.4 Growing investment in railway infrastructure in Europe
3.8.1.5 Rapidly growing urbanization and rising smart city projects in Asia Pacific
3.8.2 Industry pitfalls & challenges
3.8.2.1 Integration complexities with legacy systems
3.8.2.2 High cost of maritime equipment High installation cost and data complexity
3.9 Growth potential analysis
3.10 Porter's analysis
3.11 PESTEL analysis
Chapter 4 Competitive Landscape, 2024
4.1 Introduction
4.2 Company market share analysis
4.3 Competitive positioning matrix
4.4 Strategic outlook matrix
Chapter 5 Market Estimates & Forecast, By Mode of Transport, 2021 - 2034 ($Bn)