


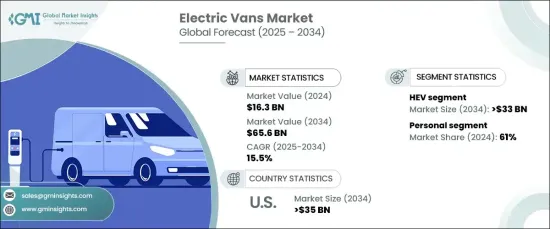
세계의 전기 밴 시장은 2024년에 163억 달러로 평가되며, 2025-2034년에 CAGR 15.5%로 확대할 것으로 예측됩니다. 이러한 성장은 배출가스에 대한 정부의 규제 강화와 함께 기후 변화 대응 및 대기오염 저감을 위한 전 세계적인 노력 증가에 기인합니다.
세계 각국 정부는 전기자동차 도입을 촉진하는 인센티브를 도입하여 기업이 친환경 차량으로 전환하도록 장려하고 있습니다. 기존 디젤 차량을 대체할 수 있는 무공해 전기 밴은 이러한 규제 프레임워크와 기업의 지속가능성 목표에 부합합니다. 배터리 기술의 발전은 주행거리 연장 및 제조 비용 감소를 통해 전기 밴의 실현 가능성을 높이고 있습니다. 이러한 발전은 환경적 인식과 규제적 지원과 함께 특히 운송 및 물류 분야에서 업계 전반 수요를 견인하고 있습니다.

전기 밴 시장은 차종에 따라 상업용과 개인용으로 구분됩니다. 2024년에 가장 큰 비중을 차지한 개인용 부문은 친환경적이고 비용 효율적인 차량에 대한 소비자 선호에 의해 주도되고 있습니다. 그러나 기업에서 운영 비용을 절감하고 지속가능성 목표를 달성하기 위해 전기 밴을 채택함에 따라 상업용 부문이 이를 능가하는 성장을 보일 것으로 예상됩니다. 충전 인프라의 확대와 정부 인센티브와 같은 요인들은 전기 밴의 상업적 채택을 더욱 촉진하여 물류 및 배송 차량에 실용적인 솔루션이 될 수 있도록 돕고 있습니다.
| 시장 범위 | |
|---|---|
| 시작연도 | 2024년 |
| 예측연도 | 2025-2034년 |
| 시작 금액 | 163억 달러 |
| 예상 금액 | 656억 달러 |
| CAGR | 15.5% |
추진력별로 보면 시장은 배터리 전기자동차(BEV)와 하이브리드 전기자동차(HEV)로 구분되며, 2024년 기준, 충전 인프라에 의존하지 않고 연비와 편의성의 균형으로 인해 HEV가 압도적인 점유율을 차지하고 있습니다. 그럼에도 불구하고 BEV는 배터리 기술의 발전으로 항속거리의 향상과 충전시간의 단축을 실현하며 인기를 끌고 있습니다. 가격 상승과 충전 네트워크의 확장으로 BEV는 개인 소비자와 기업 모두에게 더욱 매력적인 선택이 되고 있습니다. 이러한 개선이 진행됨에 따라 BEV는 향후 큰 성장을 달성하고 시장 점유율을 확대할 것으로 예상됩니다.
미국은 전기 밴 시장의 주요 기업으로 2024년 매출의 상당 부분을 차지하며, 2034년에는 350억 달러 이상에 달할 것으로 예상됩니다. 이러한 성장은 전기자동차 도입을 촉진하기 위한 유리한 정부 정책, 세제 혜택 및 보조금에 의해 지원되고 있습니다. 주요 전기자동차 제조업체의 존재와 첨단 기술에 대한 투자가 기술 혁신과 생산을 더욱 촉진하고 있습니다. 또한 미국내 충전 인프라의 확대는 전기자동차 보급의 실현 가능성을 높이고 지속가능한 운송 솔루션에 대한 수요 증가에 부응하고 있습니다. 미국 시장은 청정 상용 운송으로의 전환을 선도할 수 있는 좋은 위치에 있으며, 전기 이동성으로의 광범위한 세계 전환을 반영하고 있습니다.
The Global Electric Vans Market, valued at USD 16.3 billion in 2024, is projected to expand at a CAGR of 15.5% between 2025 and 2034. This growth stems from increasing global efforts to combat climate change and reduce air pollution, alongside stricter government regulations on emissions. Governments worldwide are introducing incentives to promote electric vehicle adoption, encouraging businesses to transition to eco-friendly fleets. Electric vans, offering zero-emission alternatives to conventional diesel-powered vehicles, align with these regulatory frameworks and corporate sustainability goals. Improvements in battery technology are also enhancing the viability of electric vans by increasing range and decreasing production costs. These advancements, combined with environmental awareness and regulatory support, are driving demand across industries, particularly in the delivery and logistics sectors.
The electric vans market is segmented by vehicle type into commercial and personal categories. The personal segment, which held a significant share in 2024, is driven by consumer preferences for eco-friendly and cost-efficient vehicles. However, the commercial segment is anticipated to outpace it in growth as businesses adopt electric vans to reduce operating costs and meet sustainability targets. Factors such as expanded charging infrastructure and government incentives further bolster the commercial adoption of electric vans, making them a practical solution for logistics and delivery fleets.
| Market Scope | |
|---|---|
| Start Year | 2024 |
| Forecast Year | 2025-2034 |
| Start Value | $16.3 Billion |
| Forecast Value | $65.6 Billion |
| CAGR | 15.5% |
By propulsion, the market is divided into battery electric vehicles (BEVs) and hybrid electric vehicles (HEVs). In 2024, HEVs held a dominant share of the market due to their balance of fuel efficiency and convenience, as they do not solely rely on electric charging infrastructure. Despite this, BEVs are gaining traction due to advancements in battery technology, which improve range and decrease charging times. Increasing affordability and expanding charging networks are making BEVs a more attractive choice for both individual consumers and businesses. As these improvements continue, BEVs are expected to experience significant growth and capture more market share in the future.
The US is a key player in the electric vans market, accounting for a substantial share of revenue in 2024, and is projected to exceed USD 35 billion by 2034. This growth is supported by favorable government policies, tax incentives, and grants aimed at promoting electric vehicle adoption. The presence of major EV manufacturers and investments in advanced technologies further drive innovation and production. Additionally, the expansion of the country's charging infrastructure enhances the feasibility of widespread EV adoption, meeting the rising demand for sustainable transportation solutions. The US market is well-positioned to lead the transition toward cleaner commercial transportation, reflecting the broader global shift toward electric mobility.