


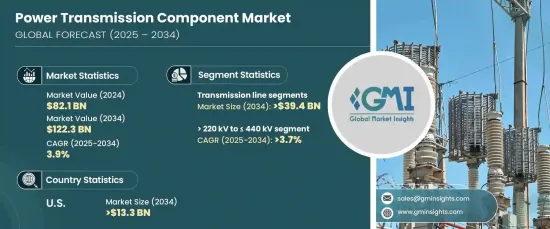
세계의 파워 트랜스미션 부품 시장은 2024년에 821억 달러에 이르렀고, 2025년부터 2034년까지 연평균 복합 성장률(CAGR) 3.9%로 성장할 것으로 예측됩니다.
이러한 성장은 에너지 수요 증가, 송전망의 현대화, 재생가능 에너지원의 통합 증가에 기여합니다. 특히 개발도상국의 급속한 도시화와 산업화는 효율적이고 신뢰성 있는 송전시스템의 필요성을 높이고 있습니다. 세계 정부와 전력회사들은 효율성 향상, 손실 최소화, 내결함성 강화를 위해 노후화된 송전망 개선에 투자하고 있습니다.

구성 요소별로 트랜스미션 라인 분야는 2034년까지 394억 달러를 창출할 것으로 예측되고 있습니다. 이러한 성장은 특히 산업 응용 분야에서 안정적이고 공간 효율적인 송전 솔루션에 대한 요구가 증가하고 있다는 배경입니다. 가스 절연 개폐 장치(GIS)는 컴팩트한 구조, 높은 신뢰성, 과제 조건 하에서의 성능으로 인기를 끌고 있습니다. 산업 자동화의 상승과 재생 가능 에너지의 보급은 GIS 기술과 통합된 고급 송전선로의 전개를 뒷받침하고 있습니다.
| 시장 범위 | |
|---|---|
| 시작 연도 | 2024년 |
| 예측 연도 | 2025-2034년 |
| 시작 금액 | 821억 달러 |
| 예측 금액 | 1,223억 달러 |
| CAGR | 3.9% |
전압 레벨별로는 220 kV 이상 440 kV 미만의 부문이 2025-2034년에 CAGR 3.7%를 달성할 것으로 예상됩니다. 이 전압 범위는 광업, 석유, 가스, 대규모 제조와 같은 중공업 및 유틸리티에서 대용량 변속기에 필수적입니다. 이러한 분야에서는 안정적이고 중단 없는 에너지 공급이 필수적이므로 효율적인 전력 시스템에 대한 수요가 증가하고 있습니다.
미국의 파워 트랜스미션 부품 시장은 2034년까지 133억 달러를 창출할 것으로 예상됩니다. 노후화된 인프라의 현대화와 효율적인 에너지 전송 시스템에 대한 수요 증가가 주요 촉진요인입니다. 풍력과 태양광과 같은 재생 가능 에너지원의 통합이 진행되고 있기 때문에 변동하는 전력 부하를 관리하고, 송전망의 안정성을 확보할 수 있는 첨단 개폐 장치 솔루션이 필요합니다.
세계의 에너지 수요와 지속가능성의 목표가 계속 송전의 정세를 형성하고 있기 때문에 기술과 인프라 개발의 진보는 미래의 요건을 충족시키기 위해 계속 중요합니다. 시장은 진화하는 에너지 요구와 기술 혁신에 적응하면서 꾸준한 성장을 이룰 것으로 예상됩니다.
The Global Power Transmission Component Market reached USD 82.1 billion in 2024 and is projected to grow at a CAGR of 3.9% from 2025 to 2034. This growth is fueled by rising energy demands, the modernization of power grids, and the increasing integration of renewable energy sources. Rapid urbanization and industrialization, particularly in developing nations, are driving the need for efficient and reliable electricity transmission systems. Governments and utilities worldwide are investing in upgrading outdated grid networks to improve efficiency, minimize losses, and enhance resilience.
In terms of components, the transmission line segment is poised to generate USD 39.4 billion by 2034. This growth is driven by the increasing need for reliable and space-efficient power transmission solutions, particularly in industrial applications. Gas-insulated switchgear (GIS) is gaining popularity for its compact structure, high reliability, and ability to perform under challenging conditions. The rise of industrial automation and the widespread adoption of renewable energy propel the deployment of advanced transmission lines integrated with GIS technology.
| Market Scope | |
|---|---|
| Start Year | 2024 |
| Forecast Year | 2025-2034 |
| Start Value | $82.1 Billion |
| Forecast Value | $122.3 Billion |
| CAGR | 3.9% |
By voltage level, the >220 kV to <=440 kV segment is expected to achieve a CAGR of 3.7% during 2025-2034. This range is essential for high-capacity power transmission in heavy industrial and utility applications, such as mining, oil and gas, and large-scale manufacturing. The demand for efficient power systems in these sectors is growing due to the critical need for a reliable and uninterrupted energy supply. Investments in infrastructure upgrades across developed nations and the rapid industrial growth in emerging economies support this segment's expansion.
U.S. power transmission component market is anticipated to generate USD 13.3 billion by 2034. The modernization of aging infrastructure and the increasing demand for efficient energy transmission systems are key drivers. The growing integration of renewable energy sources, such as wind and solar, necessitates advanced switchgear solutions capable of managing fluctuating power loads and ensuring grid stability. Additionally, the push for automation and digitalization within the U.S. industrial sector is boosting demand for smart gas-insulated switchgear equipped with IoT sensors and real-time monitoring features.
As global energy demands and sustainability goals continue to shape the power transmission landscape, advancements in technology and infrastructure development will remain critical to meeting future requirements. The market is set to witness steady growth as it adapts to evolving energy needs and technological innovations.