과일 및 야채 가공 장비 시장 : 시장 기회, 성장 촉진요인, 산업 동향 분석, 예측(2025-2034년)
Fruit and Vegetable Processing Equipment Market Opportunity, Growth Drivers, Industry Trend Analysis, and Forecast 2025 - 2034
상품코드:1665308
리서치사:Global Market Insights Inc.
발행일:2024년 12월
페이지 정보:영문 180 Pages
라이선스 & 가격 (부가세 별도)
ㅁ Add-on 가능: 고객의 요청에 따라 일정한 범위 내에서 Customization이 가능합니다. 자세한 사항은 문의해 주시기 바랍니다.
한글목차
세계의 과일 및 야채 가공 장비 시장은 2024년에 68억 달러로 평가되었고, 2025년부터 2034년까지 CAGR 6.3%로 확대될 것으로 예상되고 있습니다. 이 성장의 주요 요인은 가공된 편리한 식품 옵션에 대한 소비자 수요의 급증, 자동화 기술의 발전, 식품 안전 및 위생 기준의 중요성 증가입니다. 그 결과, 식품 가공업자는 이러한 진화하는 수요에 대응하기 위해, 최첨단 고성능 기기를 채용하게 되어 왔습니다.
2024년 시장 세척 부문은 15억 달러의 수익을 올렸으며 2034년까지 연평균 복합 성장률(CAGR) 7.8%로 성장할 것으로 예상됩니다. 첨단 세척 시스템에 대한 수요 증가는 식품 안전 규정의 엄격화 및 청결하고 즉석에서 먹을 수 있는 농산물에 대한 소비자 선호도 증가에 뒷받침되고 있습니다. 이러한 고급 세척 기술은 과일 및 야채의 영양가와 신선도를 유지하면서 농약, 오염물질 및 먼지를 효과적으로 제거하도록 설계되었습니다. 소비자의 유기농 농산물과 신선한 농산물에 대한 지향이 높아짐에 따라 자동화된 대용량 세정 시스템에 대한 요구가 커지고 있으며, 가공업자는 품질에 타협하지 않고 대규모 생산의 요구에 부응할 수 있습니다.
시장 범위
시작 연도
2024년
예측 연도
2025-2034년
시작 금액
68억 달러
예측 금액
123억 달러
CAGR
6.3%
운전 방법별로는 자동 부문이 2024년 시장 점유율의 41.8%를 차지하였고, 2025년부터 2034년까지 CAGR은 7.1%로 예측됩니다. 반면, 반자동 부문은 같은 기간에 CAGR 5.9%로 성장할 것으로 예상됩니다. 자동화 시스템으로의 전환은 식품 생산의 효율성, 일관성 및 정밀도 향상에 대한 요구가 큰 요인이 되고 있습니다. 자동 가공 장비는 인건비를 줄이고 가공 속도를 높이고 전반적인 제품 품질을 향상시켜 대규모 사업에 매우 매력적인 선택입니다. 즉석에서 먹을 수 있는 식품에 대한 소비자 수요가 증가하는 가운데, 엄격한 안전 및 위생 기준을 유지하면서 대량 생산에 대응할 수 있는 자동화 시스템은 산업의 요건을 충족하기 위해서 필수가 되고 있습니다.
미국에서 과일 및 야채 가공 장비 시장은 2024년에 16억 달러에 이르렀고, 2034년까지 연평균 복합 성장률(CAGR) 7%로 성장할 것으로 예상됩니다. 이러한 성장은 소비자의 선호도가 즉석에서 먹을 수 있는 식사 옵션으로 이동함에 따라 가공 식품 및 간편 식품에 대한 수요가 증가하고 있다는 배경에 있습니다. 첨단 기술에 대한 투자는 업무 효율성 향상, 인건비 절감, 제품 품질 개선에 도움이 됩니다. 자동화는 생산 속도를 가속화하고 일관성 향상을 촉진함으로써 이 성장에 중심적인 역할을 하며, 기업이 시장 경쟁을 유지하면서 소비자의 기대에 부응하는 데 도움이 됩니다.
목차
제1장 조사 방법 및 조사 범위
시장 범위 및 정의
기본 추정 및 계산
예측 계산
데이터 소스
1차 데이터
2차 데이터
유료 정보원
공적 정보원
제2장 주요 요약
제3장 산업 인사이트
생태계 분석
밸류체인에 영향을 주는 요인
이익률 분석
변혁
장래 전망
제조업체
유통업체
공급자의 상황
이익률 분석
주요 뉴스 및 대처
규제 상황
영향 요인
성장 촉진요인
가공식품과 편의점 수요 증가
가공 장비의 기술적 진보
신흥 시장의 식품 가공 산업 확대
산업의 잠재적 리스크 및 과제
높은 초기 투자 비용
공급망의 혼란과 원료 부족
성장의 잠재성 분석
기술 개요
Porter's Five Forces 분석
PESTEL 분석
제4장 경쟁 구도
서문
기업 점유율 분석
경쟁 포지셔닝 매트릭스
전략 전망 매트릭스
제5장 시장 추정 및 예측 : 유형별(2021-2034년)
주요 동향
세정
껍질 벗기기
컷
주스
브랜칭
포장
기타
제6장 시장 추정 및 예측 : 오퍼레이션별(2021-2034년)
주요 동향
자동
반자동
수동
제7장 시장 추정 및 예측 : 최종 용도별(2021-2034년)
주요 동향
식품 가공 산업
외식 산업
제8장 시장 추정 및 예측 : 카테고리별(2021-2034년)
주요 동향
과일
야채
제9장 시장 추정 및 예측 : 용도별(2021-2034년)
주요 동향
프레시 및 프레시 컷
캔
건조 및 탈수
냉동
기타(피클, 조미료 등)
제10장 시장 추정 및 예측 : 최종 이용 산업별(2021-2034년)
주요 동향
소규모 가공 공장
중규모 가공 공장
공업용 및 대규모 가공 공장
제11장 시장 추정 및 예측 : 유통 채널별(2021-2034년)
주요 동향
직접 판매
간접 판매
제12장 시장 추정 및 예측 : 지역별(2021-2034년)
주요 동향
북미
미국
캐나다
유럽
영국
독일
프랑스
이탈리아
스페인
아시아태평양
중국
일본
인도
한국
호주
말레이시아
인도네시아
라틴아메리카
브라질
멕시코
중동 및 아프리카
아랍에미리트(UAE)
사우디아라비아
남아프리카
제13장 기업 프로파일
Alfa Laval AB
Bertuzzi Food Processing Srl
Bucher Industries AG
Buhler Group
FENCO Food Machinery Srl
GEA Group
Heat and Control, Inc.
JBT Corporation
Key Technology, Inc.
Krones AG
Lyco Manufacturing, Inc.
Marel
Mepaco
Navatta Group Food Processing Srl
Sormac BV
AJY
영문 목차
영문목차
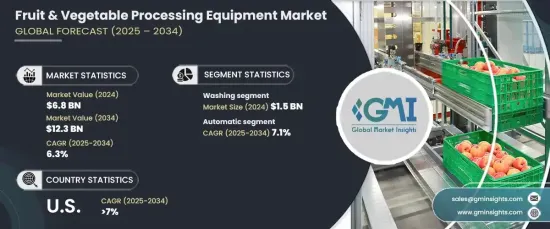
The Global Fruit And Vegetable Processing Equipment Market was valued at USD 6.8 billion in 2024 and is expected to expand at a compound annual growth rate (CAGR) of 6.3% from 2025 to 2034. This growth is primarily driven by a surge in consumer demand for processed and convenient food options, technological advancements in automation, and an increased emphasis on food safety and hygiene standards. As a result, food processors are increasingly adopting state-of-the-art, high-performance equipment to meet these evolving demands.
In 2024, the washing segment of the market generated USD 1.5 billion in revenue and is projected to grow at a CAGR of 7.8% through 2034. The rising demand for advanced washing systems is being propelled by stricter food safety regulations and the growing consumer preference for clean, ready-to-eat produce. These advanced washing technologies are designed to effectively remove pesticides, contaminants, and dirt while preserving the nutritional value and freshness of fruits and vegetables. As consumers increasingly lean toward organic and fresh produce, the need for automated, high-capacity washing systems is growing, enabling processors to meet the demands of large-scale production without compromising quality.
Market Scope
Start Year
2024
Forecast Year
2025-2034
Start Value
$6.8 Billion
Forecast Value
$12.3 Billion
CAGR
6.3%
In terms of operational methods, the automatic segment represented 41.8% of the market share in 2024 and is forecast to experience a CAGR of 7.1% between 2025 and 2034. Meanwhile, the semi-automatic segment is projected to grow at a CAGR of 5.9% during the same period. The shift toward automated systems is largely driven by the need for greater efficiency, consistency, and precision in food production. Automatic processing equipment reduces labor costs, boosts processing speeds, and enhances overall product quality, making it a highly attractive option for large-scale operations. With consumer demand for ready-to-eat foods on the rise, automated systems capable of handling high-volume production while maintaining stringent safety and hygiene standards are becoming essential to meeting industry requirements.
In the United States, the fruit and vegetable processing equipment market reached USD 1.6 billion in 2024 and is expected to grow at a CAGR of 7% through 2034. This growth is fueled by the increasing demand for processed and convenience foods as consumer preferences shift toward more ready-to-eat meal options. Investments in advanced technologies are helping to boost operational efficiency, reduce labor costs, and improve product quality. Automation plays a central role in this growth by facilitating faster production rates and greater consistency, helping companies meet the growing expectations of consumers while maintaining their competitive edge in the marketplace.
Table of Contents
Chapter 1 Methodology & Scope
1.1 Market scope & definitions
1.2 Base estimates & calculations
1.3 Forecast calculations.
1.4 Data sources
1.4.1 Primary
1.4.2 Secondary
1.4.2.1 Paid sources
1.4.2.2 Public sources
Chapter 2 Executive Summary
2.1 Industry synopsis, 2021-2034
Chapter 3 Industry Insights
3.1 Industry ecosystem analysis
3.1.1 Factor affecting the value chain
3.1.2 Profit margin analysis
3.1.3 Disruptions
3.1.4 Future outlook
3.1.5 Manufacturers
3.1.6 Distributors
3.2 Supplier landscape
3.3 Profit margin analysis
3.4 Key news & initiatives
3.5 Regulatory landscape
3.6 Impact forces
3.6.1 Growth drivers
3.6.1.1 Increasing demand for processed and convenience foods
3.6.1.2 Technological advancements in processing equipment
3.6.1.3 Expansion of the food processing industry in emerging markets
3.6.2 Industry pitfalls & challenges
3.6.2.1 High initial investment costs
3.6.2.2 Supply chain disruptions and raw material shortages