푸시풀(Push Pull) 도구 시장 기회, 성장 촉진 요인, 산업 동향 분석, 예측(2024-2032년)
Push Pull Tools Market Opportunity, Growth Drivers, Industry Trend Analysis, and Forecast 2024 - 2032
상품코드:1665101
리서치사:Global Market Insights Inc.
발행일:2024년 12월
페이지 정보:영문 220 Pages
라이선스 & 가격 (부가세 별도)
ㅁ Add-on 가능: 고객의 요청에 따라 일정한 범위 내에서 Customization이 가능합니다. 자세한 사항은 문의해 주시기 바랍니다.
한글목차
푸시풀 도구 세계 시장은 2023년에 11억 4,000만 달러로 평가되었으며, 2024년부터 2032년에 걸쳐 CAGR 4.2%로 안정된 성장이 전망되고 있습니다.
산업계에서는 중량물의 효율적인 이동, 정확한 정렬, 신중한 위치결정이 점점 요구되고 있으며, 푸시풀 도구의 역할은 다양한 분야의 작업에 필수적이 되고 있습니다. 이러한 도구는 생산성을 높이고 신체적 부담을 줄이고 직장 안전을 향상시키는 것으로 널리 알려져 있습니다. 제조기술의 진보와 작업효율의 중시가 높아짐에 따라 푸시풀 도구 수요가 확대되고 있습니다. 제조, 건설, 물류, 자동차 등의 분야에서 중요한 역할을 하는 푸시풀 도구는 안전 기준과 규제 요건 증가와 인체 공학적 설계의 중시에 의해 더욱 강화되고 있습니다. 산업 활동이 세계적으로 계속 증가하고 있는 가운데, 기술 혁신과 산업 인프라의 지속적인 발전으로 이 시장은 큰 성장을 기대하고 있습니다.
2023년 표준 푸시풀 도구 부문은 4억 9,900만 달러의 수익을 얻었으며 예측 기간 동안 CAGR 4.4%의 성장률을 기록할 것으로 예상됩니다. 이러한 도구는 자재관리 및 조립 공정을 간소화할 수 있는 능력이 가장 중요한 제조업 및 건설업과 같은 산업에서 필수적입니다. 표준 푸시풀 도구는 생산성을 높이면서 작업자의 부담을 크게 줄이고 인체공학과 안전성 향상에 중점을 둔 산업에서 중요한 요소가 되고 있습니다. 제조업과 건설업이 계속 성장함에 따라 이러한 도구에 대한 수요는 증가할 것으로 예상되며 시장의 지속적인 확장을 보장합니다.
시장 범위
시작연도
2023
예측연도
2024-2032
시작금액
11억 4,000만 달러
예측 금액
16억 4,000만 달러
CAGR
4.2%
석유 및 가스 섹터는 2023년 시장 점유율의 29%를 차지했으며 2024년부터 2032년에 걸쳐 CAGR 4.5%의 성장률을 기록할 것으로 예상됩니다. 이 분야에서 푸시풀 도구는 유지보수 점검 시 복잡한 장비와 자재관리를 수행하고 적절한 정렬과 확실한 위치 결정을 수행하는 데 매우 중요합니다. 장비 고장을 방지하고 다운타임을 최소화하는 푸시풀 도구의 역할은 중요한 자산의 수명을 연장하는 데 필수적입니다. 인프라, 탐사활동, 보수작업에 대한 많은 투자로 석유 및 가스산업에서의 푸시풀 도구 수요가 대폭 증가할 것으로 예상됩니다.
미국에서 푸시풀 도구 시장은 2023년에 2억 4,000만 달러로 평가되었으며, 2032년까지 연평균 복합 성장률(CAGR) 4.3%의 성장률을 기록할 것으로 예상됩니다. 선진적인 산업 정세를 가진 미국에서는 제조업과 건설업에서의 수요가 큽니다. 안전, 작업 효율, 정밀도를 우선하는 산업이 자재관리, 부품 정렬, 장비 설치 등의 주요 용도로 푸시풀 도구의 채용을 촉진하고 있습니다. 이러한 분야의 성장과 기술의 진보가 결합되어 푸시풀 도구의 지속적인 수요가 촉진될 것으로 예상됩니다.
목차
제1장 조사 방법과 조사 범위
시장 범위와 정의
기본 추정과 계산
예측 계산
데이터 소스
1차 데이터
2차 데이터
유료 정보원
공적 정보원
제2장 주요 요약
제3장 업계 인사이트
생태계 분석
밸류체인에 영향을 주는 요인
이익률 분석
파괴
장래의 전망
제조업체
유통업체
공급자의 상황
이익률 분석
주요 뉴스 및 이니셔티브
규제 상황
영향요인
성장 촉진요인
산업 자동화에 대한 수요 증가
효율적인 자재관리에 대한 요구 증가
업계의 잠재적 위험 및 과제
인식과 트레이닝의 부족
성장 가능성 분석
Porter's Five Forces 분석
PESTEL 분석
제4장 경쟁 구도
소개
기업 점유율 분석
경쟁 포지셔닝 매트릭스
전략 전망 매트릭스
제5장 시장 추정 및 예측 : 툴 유형별, 2021년-2032년
주요 동향
표준 푸시풀 도구
스트레이트 푸시 풀 공구
조정가능한 푸시풀 도구
헤비 듀티 푸시 풀 공구
유압 푸시풀 도구
공압식 푸시풀 도구
회전식 푸시풀 도구
스위블 헤드 공구
피벗 헤드 공구
자석 푸시 풀 공구
고정식 마그넷 공구
조정가능한 자석 공구
기타(인간 공학에 근거한 푸시 풀 공구 등)
제6장 시장 추정 및 예측 : 내하중별, 2021년-2032년
주요 동향
최대 50kg
50-200kg
200kg 이상
제7장 시장 추정 및 예측 : 용도별, 2021년-2032년
주요 동향
자재관리
얼라인먼트 작업
점검 및 유지보수
기타(긴급 작업 등)
제8장 시장 추정 및 예측 : 최종 용도별, 2021년-2032년
주요 동향
석유 및 가스
건설
제조업
광업
기타(물류 등)
제9장 시장 추정 및 예측 : 유통 채널별, 2021년-2032년
주요 동향
직접 유통
간접 유통
제10장 시장 추정 및 예측 : 지역별, 2021년-2032년
주요 동향
북미
미국
캐나다
유럽
영국
독일
프랑스
이탈리아
스페인
러시아
아시아태평양
중국
인도
일본
한국
호주
라틴아메리카
브라질
멕시코
중동 및 아프리카
UAE
사우디아라비아
남아프리카
제11장 기업 프로파일
Enerpac Tool Group
Hydratight
Schroeder Industries
SPX Flow, Inc.
Master Pull, LLC
Graco Inc.
Stanley Black &Decker, Inc.
Grote Industries, Inc.
Tuthill Corporation
WIKA Instruments Ltd.
Lindapter International Ltd.
Cleveland Cable Company
Ridge Tool Company
Hilti Corporation
Jergens, Inc.
SHW
영문 목차
영문목차
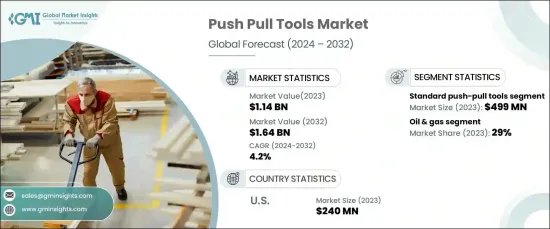
The Global Push Pull Tools Market, valued at USD 1.14 billion in 2023, is expected to grow steadily at a CAGR of 4.2% from 2024 to 2032. As industries increasingly demand efficient movement, precise alignment, and careful positioning of heavy materials, the role of push-pull tools becomes indispensable in operations across various sectors. These tools are widely recognized for enhancing productivity, reducing physical strain, and improving safety in the workplace. With advancements in manufacturing technologies and a growing emphasis on operational efficiency, demand for push-pull tools is expanding. Their crucial role in sectors like manufacturing, construction, logistics, and automotive is further bolstered by rising safety standards, regulatory requirements, and a focus on ergonomic designs. As industrial activities continue to increase globally, this market is poised for significant growth, driven by technological innovations and the continuous development of industrial infrastructure.
In 2023, the standard push-pull tools segment garnered USD 499 million in revenue and is projected to expand at a CAGR of 4.4% during the forecast period. These tools are essential in industries such as manufacturing and construction, where their capacity to streamline material handling and assembly processes is paramount. Standard push-pull tools significantly reduce worker strain while enhancing productivity, a key factor in industries focused on improving ergonomics and safety. The demand for these tools is expected to rise as manufacturing and construction industries continue to experience growth, ensuring consistent market expansion.
Market Scope
Start Year
2023
Forecast Year
2024-2032
Start Value
$1.14 Billion
Forecast Value
$1.64 Billion
CAGR
4.2%
The oil and gas sector accounted for 29% of the market share in 2023 and is projected to grow at a CAGR of 4.5% between 2024 and 2032. In this sector, push-pull tools are crucial for handling complex equipment and materials during maintenance and inspections, ensuring proper alignment and secure positioning. Their role in preventing equipment failures and minimizing downtime is vital to prolonging the lifespan of critical assets. With substantial investments in infrastructure, exploration activities, and maintenance operations, the demand for push-pull tools in the oil and gas industry is expected to rise significantly.
In the U.S., the push-pull tools market was valued at USD 240 million in 2023 and is forecasted to grow at a CAGR of 4.3% through 2032. With its advanced industrial landscape, the U.S. sees significant demand from its manufacturing and construction sectors. Industries that prioritize safety, operational efficiency, and precision are driving the adoption of push-pull tools, with key applications including material handling, component alignment, and equipment installation. The growth of these sectors, coupled with advancements in technology, is expected to fuel sustained demand for push-pull tools.
Table of Contents
Chapter 1 Methodology & Scope
1.1 Market scope & definitions
1.2 Base estimates & calculations
1.3 Forecast calculations.
1.4 Data sources
1.4.1 Primary
1.4.2 Secondary
1.4.2.1 Paid sources
1.4.2.2 Public sources
Chapter 2 Executive Summary
2.1 Industry synopsis, 2021-2032
Chapter 3 Industry Insights
3.1 Industry ecosystem analysis
3.1.1 Factor affecting the value chain
3.1.2 Profit margin analysis
3.1.3 Disruptions
3.1.4 Future outlook
3.1.5 Manufacturers
3.1.6 Distributors
3.2 Supplier landscape
3.3 Profit margin analysis.
3.4 Key news & initiatives
3.5 Regulatory landscape
3.6 Impact forces
3.6.1 Growth drivers
3.6.1.1 Increasing demand for industrial automation
3.6.1.2 Rising need for efficient material handling