재생 열 산화제 시장 기회, 성장 촉진요인, 산업 동향 분석 및 예측(2024-2032년)
Regenerative Thermal Oxidizers Market Opportunity, Growth Drivers, Industry Trend Analysis, and Forecast 2024 - 2032
상품코드:1664876
리서치사:Global Market Insights Inc.
발행일:2024년 12월
페이지 정보:영문 220 Pages
라이선스 & 가격 (부가세 별도)
ㅁ Add-on 가능: 고객의 요청에 따라 일정한 범위 내에서 Customization이 가능합니다. 자세한 사항은 문의해 주시기 바랍니다.
한글목차
세계의 재생 열 산화제 시장은 2023년 101억 달러로 평가되었고 2024년부터 2032년까지 연평균 복합 성장률(CAGR) 5.2%로 확대될 것으로 예측되고 있습니다.
이러한 견조한 성장의 배경은 환경 의식 증가와 산업 배출물의 억제를 목적으로 하는 규제 강화를 포함합니다. 다양한 산업의 기업들이 운영 효율성을 최적화하면서 컴플라이언스 기준을 충족하기 위해 첨단 오염 제어 기술을 채택하고 있으며, RTO 시스템이 배출 가스 관리를 위한 강력한 솔루션으로 확고한 지위를 구축하고 있습니다.
유형별로는 싱글베드 부문이 2023년에 46억 달러의 수익을 차지했고 2032년까지 연평균 복합 성장률(CAGR) 5.6%로 성장할 것으로 예측됩니다. 싱글베드 RTO는 비용 효과적이고 컴팩트한 디자인으로 널리 인정받고 있으며, 예산이 제한된 산업 및 소규모 사업에 최선의 선택이 되었습니다. 이 시스템은 설치 비용과 유지 보수 비용을 모두 절감하는 간단한 구성을 특징으로 하며 성능 저하 없이 배출 가스를 제어하는 효율적이고 예산 친화적인 솔루션을 제공합니다.
시장 범위
시작 연도
2023년
예측 연도
2024-2032년
시작 금액
101억 달러
예측 금액
159억 달러
CAGR
5.2%
제품 유형별로 2023년 회전식 부문이 선두에 올랐고 61% 시장 점유율을 얻었습니다. 이 부문은 예측 기간 동안 CAGR 5.5%로 성장할 것으로 예상됩니다. 회전식 RTO는 연속 대량 운전이 필요한 산업에서 특히 인기가 있습니다. 혁신적인 회전식 열교환기 설계는 에너지 효율을 높이고 일관된 배출 제어를 실현하며 대규모 생산 환경에서 비용 효율적이고 환경 친화적인 솔루션 수요를 충족합니다.
북미는 2023년 재생 열 산화제 시장에서 82%의 점유율을 차지했고 미국이 이 지역을 선도하고 있습니다. 이러한 우위는 휘발성 유기 화합물(VOC)과 유해 대기 오염물질(HAP)을 대상으로 하는 엄격한 환경 규제와 정책에 의한 점이 큽니다. 정부의 엄격한 배출 기준 시행으로 산업계는 RTO 시스템과 같은 첨단 기술을 채택하고 컴플라이언스를 확보하고 환경에 미치는 영향을 줄이고 있습니다.
목차
제1장 조사 방법과 조사 범위
시장 범위와 정의
기본 추정과 계산
예측 계산
데이터 소스
1차
2차
유료 소스
공개 소스
제2장 주요 요약
제3장 업계 인사이트
업계 생태계 분석
밸류체인에 영향을 주는 요인
이익률 분석
방해
향후 전망
제조업체
유통업체
공급자의 상황
이익률 분석
주요 뉴스·이니셔티브
규제 상황
영향요인
성장 촉진요인
에너지 효율에 대한 수요 증가
산업용도 확대
업계의 잠재적 리스크·과제
시장의 포화와 치열한 경쟁
지속가능성에 대한 우려
성장 가능성 분석
Porter's Five Forces 분석
PESTEL 분석
제4장 경쟁 구도
서론
기업의 시장 점유율 분석
경쟁 포지셔닝 매트릭스
전략 전망 매트릭스
제5장 시장 추계·예측 : 유형별(2021-2032년), 10억 달러
주요 동향
싱글 베드
더블 베드
트리플 베드
제6장 시장 추계·예측 : 제품 유형별(2021-2032년), 10억 달러
주요 동향
회전식
컴팩트
제7장 시장 추계·예측 : 제어 시스템별(2021-2032년), 10억 달러
주요 동향
휘발성 유기 화합물
유해 대기 오염 물질
악취
제8장 시장 추계·예측 : 전원별(2021-2032년), 10억 달러
주요 동향
가스
전기
제9장 시장 추계·예측 : 최종 용도별(2021-2032년), 10억 달러
주요 동향
인쇄 및 포장
화학제조
석유 및 가스
식품가공
자동차
기타(광업 등)
제10장 시장 추계·예측 : 유통 채널별(2021-2032년), 10억 달러
주요 동향
직접
간접
제11장 시장 추계·예측 : 지역별(2021-2032년), 10억 달러
주요 동향
북미
미국
캐나다
유럽
영국
독일
프랑스
이탈리아
스페인
러시아
아시아태평양
중국
인도
일본
한국
호주
라틴아메리카
브라질
멕시코
중동 및 아프리카
UAE
사우디아라비아
남아프리카
제12장 기업 프로파일
Air Clear
Anguil Environmental Systems
Biothermica Technologies
Catalytic Products International
Condorchem Envitech
EPA Technologies
Fives Group
Gulf Coast Environmental Systems
HIDROJET
Kono Kogyo
Nitro Environmental
Ship &Shore Environmental
The CMM Group
TKS Industrial Company
Trion
KTH
영문 목차
영문목차
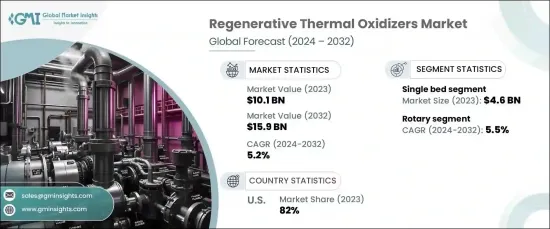
The Global Regenerative Thermal Oxidizers Market was valued at USD 10.1 billion in 2023 and is projected to expand at a CAGR of 5.2% from 2024 to 2032. This robust growth is driven by increasing environmental awareness and stricter regulations aimed at curbing industrial emissions. Businesses across various industries are adopting advanced pollution control technologies to meet compliance standards while optimizing operational efficiency, solidifying RTO systems as the go-to solution for emission management.
By type, the single bed segment accounted for USD 4.6 billion in revenue in 2023 and is forecasted to grow at a CAGR of 5.6% through 2032. Single bed RTOs are widely recognized for their cost-effectiveness and compact design, making them a top choice for industries with limited budgets or smaller-scale operations. These systems feature simplified configurations that reduce both installation and maintenance costs, offering an efficient and budget-friendly solution for controlling emissions without compromising performance.
Market Scope
Start Year
2023
Forecast Year
2024-2032
Start Value
$10.1 Billion
Forecast Value
$15.9 Billion
CAGR
5.2%
In terms of product type, the rotary segment emerged as the leader in 2023, capturing a 61% market share. This segment is expected to grow at a CAGR of 5.5% during the forecast period. Rotary RTOs are particularly popular in industries requiring continuous, high-volume operations. Their innovative rotating heat exchange design boosts energy efficiency and delivers consistent emissions control, meeting the demand for cost-effective and eco-friendly solutions in large-scale production environments.
North America held a commanding 82% share of the regenerative thermal oxidizers market in 2023, with the U.S. leading the region. This dominance is largely due to stringent environmental regulations and policies targeting volatile organic compounds (VOCs) and hazardous air pollutants (HAPs). Government enforcement of strict emission standards has driven industries to adopt advanced technologies such as RTO systems, ensuring compliance and reducing environmental impact.